

Why August 2026 Sent Solar Output in Opposite Directions Across North America
Drought lifted Texas irradiance as Midwest rain and Pacific storms cut solar output
August 2026 produced sharply divided solar conditions across North America. A persistent high-pressure ridge and severe summer weather systems pushed dust accumulation on Texas solar installations to historical highs, while record rainfall suppressed solar output across parts of the Midwest.
Satellite observation systems calculated the solar resource figures by tracking cloud coverage and atmospheric aerosols globally at a 1-to-2-kilometer spatial resolution through machine-learning algorithms. The underlying data supports radiation models with a typical bias of under 2% and real-time management for more than 350 renewable energy companies overseeing over 350 gigawatts of solar capacity worldwide.
In south-central Texas, extended drought created significant operational hurdles for utility-scale solar assets. Performance data tracked by solar modeling platform Solcast showed modeled soiling losses near Dallas reaching nearly 2% by the end of August, the highest late-August performance drag recorded in the region since data tracking began in 2007.


Texas and Oklahoma also finished roughly 10% above monthly historical averages in Global Horizontal Irradiance, or GHI. GHI is the total amount of shortwave radiation received from above by a surface horizontal to the ground. Both states recorded one of their five driest Augusts on record, while above-average irradiance extended across most Mexican states.
The regional contrast followed atmospheric circulation patterns that left a heavy, persistent high-pressure ridge centered over the Four Corners and a strong low-pressure anomaly over Ontario, Canada. High pressure over the Four Corners suppressed cloud development across the south-central United States and northern Mexico.
Dry conditions through July and August caused particulate buildup on unwashed panels to climb continuously after a wet June had kept early-summer panel soiling close to zero. Across the full June-to-August period, 2026 ranked as the second-highest summer soiling season in the 20-year series.
Ontario’s low-pressure system funnelled continuous cloud cover and moisture across the Upper Midwest and Great Lakes. Indiana and Ohio both recorded their wettest August on record, while GHI fell 17% below normal in Chicago, 10% below average in Toronto, and 8% below average in Buffalo.
Wildfires added atmospheric shading farther northwest. Ongoing blazes across British Columbia and the Pacific Northwest sent high-altitude smoke plumes downwind into the northern interior states. Aerosol analysis indicated that smoke reduced August GHI by 1% to 2% across the Northwest and North-Central states, although baseline irradiance in the Pacific Northwest still finished roughly 5% above average.
In the Pacific West, Southern California and the interior Western states ended the month approximately 5% below seasonal irradiance averages. Multi-year daily irradiance distributions nevertheless confirm that Southern California remains among the highest-yielding solar resource regions in the nation. Across the contiguous U.S., broad heat anomalies made August 2026 one of the top ten warmest Augusts on record.
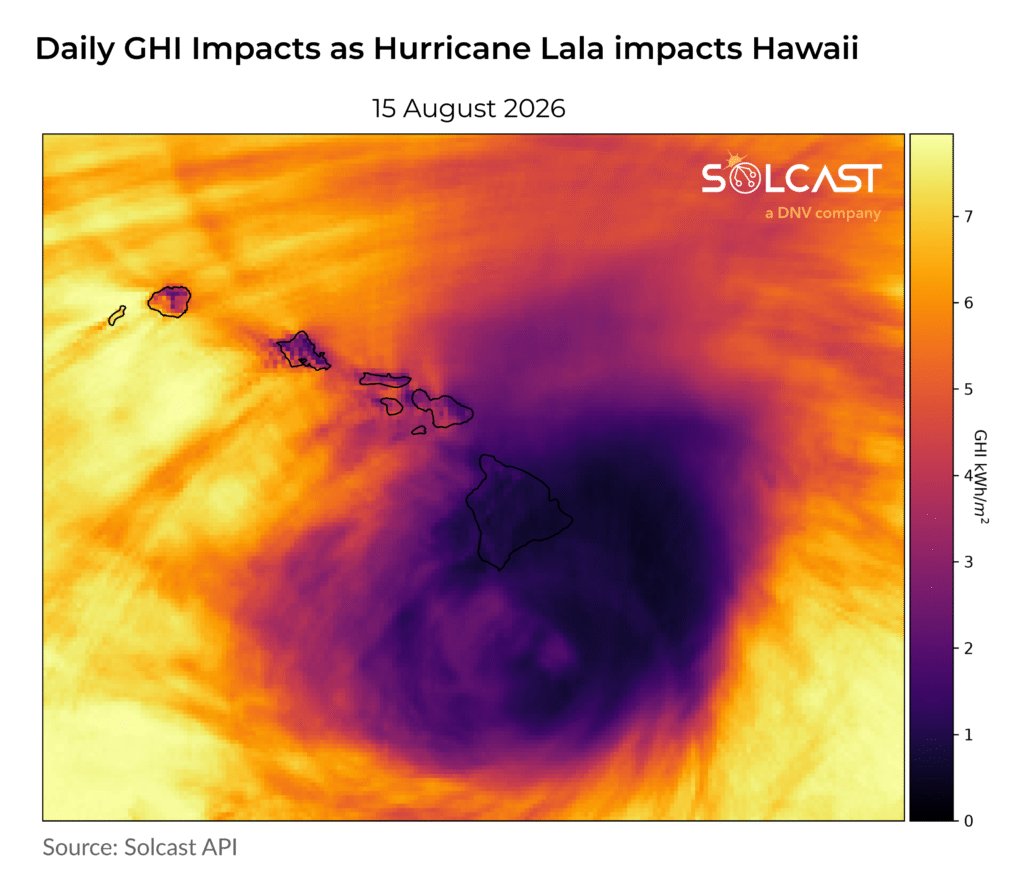
Extreme tropical weather affected western assets as Hurricane Lala made Hawaii’s first direct hurricane landfall since Hurricane Iniki struck the islands in 1992. Lala brought wind gusts of 90 mph and more than 30 inches of rain, triggering severe flooding, power grid disruptions, and structural damage to housing and roadways.
Hawaii received over 200% of its normal August precipitation during the storm, yet monthly GHI averaged only 4% below normal because the storm system crossed the island chain rapidly over just a few days. Hawaii also recorded its third-warmest August in 37 years.
Elevated hurricane activity in the Central and Eastern Pacific contrasted with quiet conditions in the Atlantic basin during a strengthening El Niño event. Warm equatorial ocean temperatures supported Pacific storm development, while atmospheric shear typical of El Niño conditions suppressed tropical Atlantic storm formation.




One Comment