
Bitcoin Tests Key Resistance Above $64,000 as Macro Tailwinds Clash With Bearish Technical Signals
Cooling inflation and strong bank earnings boost risk assets, but technical indicators and prediction markets signal caution for BTC.
While Wall Street enjoyed a highly productive Tuesday, the digital asset market continues to navigate a more precarious path. Despite a macro environment that is quietly shifting in favor of risk assets, Bitcoin remains locked in a technical tug-of-war, leaving market participants to wonder whether its recent upward move is a genuine trend reversal or a temporary relief rally.
Equities rallied on Tuesday, with the S&P 500 gaining 0.39% and the tech-heavy Nasdaq climbing 0.67%. The primary catalyst for the optimism was the latest inflation data: the June Producer Price Index report showed that wholesale inflation came in cooler than economists had projected. Producer prices actually declined by 0.3% over the month, largely dragged down by a sharp drop in retail gasoline prices. This cooling of wholesale price pressures has significantly altered expectations for interest rate policy. According to CME FedWatch data, the probability of a Federal Reserve rate hike in July has plummeted from 31% last week to just 12.3% today.
For risk assets like cryptocurrencies and technology stocks, a pausing or easing Fed is historically a major tailwind. When borrowing costs stabilize or decline, capital tends to flow out of safe-haven cash yields and back into speculative growth assets. Reflecting this calm, risk-on sentiment, the Cboe Volatility Index (VIX)—often referred to as Wall Street’s “fear gauge”—dropped to 16.5 points, signaling that equity traders are not anticipating any immediate market shocks. Adding to the bullish macro picture, major financial institutions including Goldman Sachs, Morgan Stanley, JPMorgan Chase, and Citigroup all reported second-quarter earnings that surpassed consensus analyst estimates. The broader macroeconomic backdrop is, by almost all accounts, stable and optimistic.
Yet, the cryptocurrency charts tell a far more complicated story.
A Breakout Seeking Confirmation
On Tuesday, Bitcoin managed to punch through the stubborn resistance level at $64,000, reaching an intraday high of $65,511. However, the asset struggled to maintain its peak momentum, ultimately settling at $64,858—representing a flat daily performance with a minor 0.18% decline on the forming candlestick. While breaking above a level that has repeatedly capped price action for the past two weeks is technically constructive, the breakout lacks the high-volume conviction typically seen at major trend turning points.
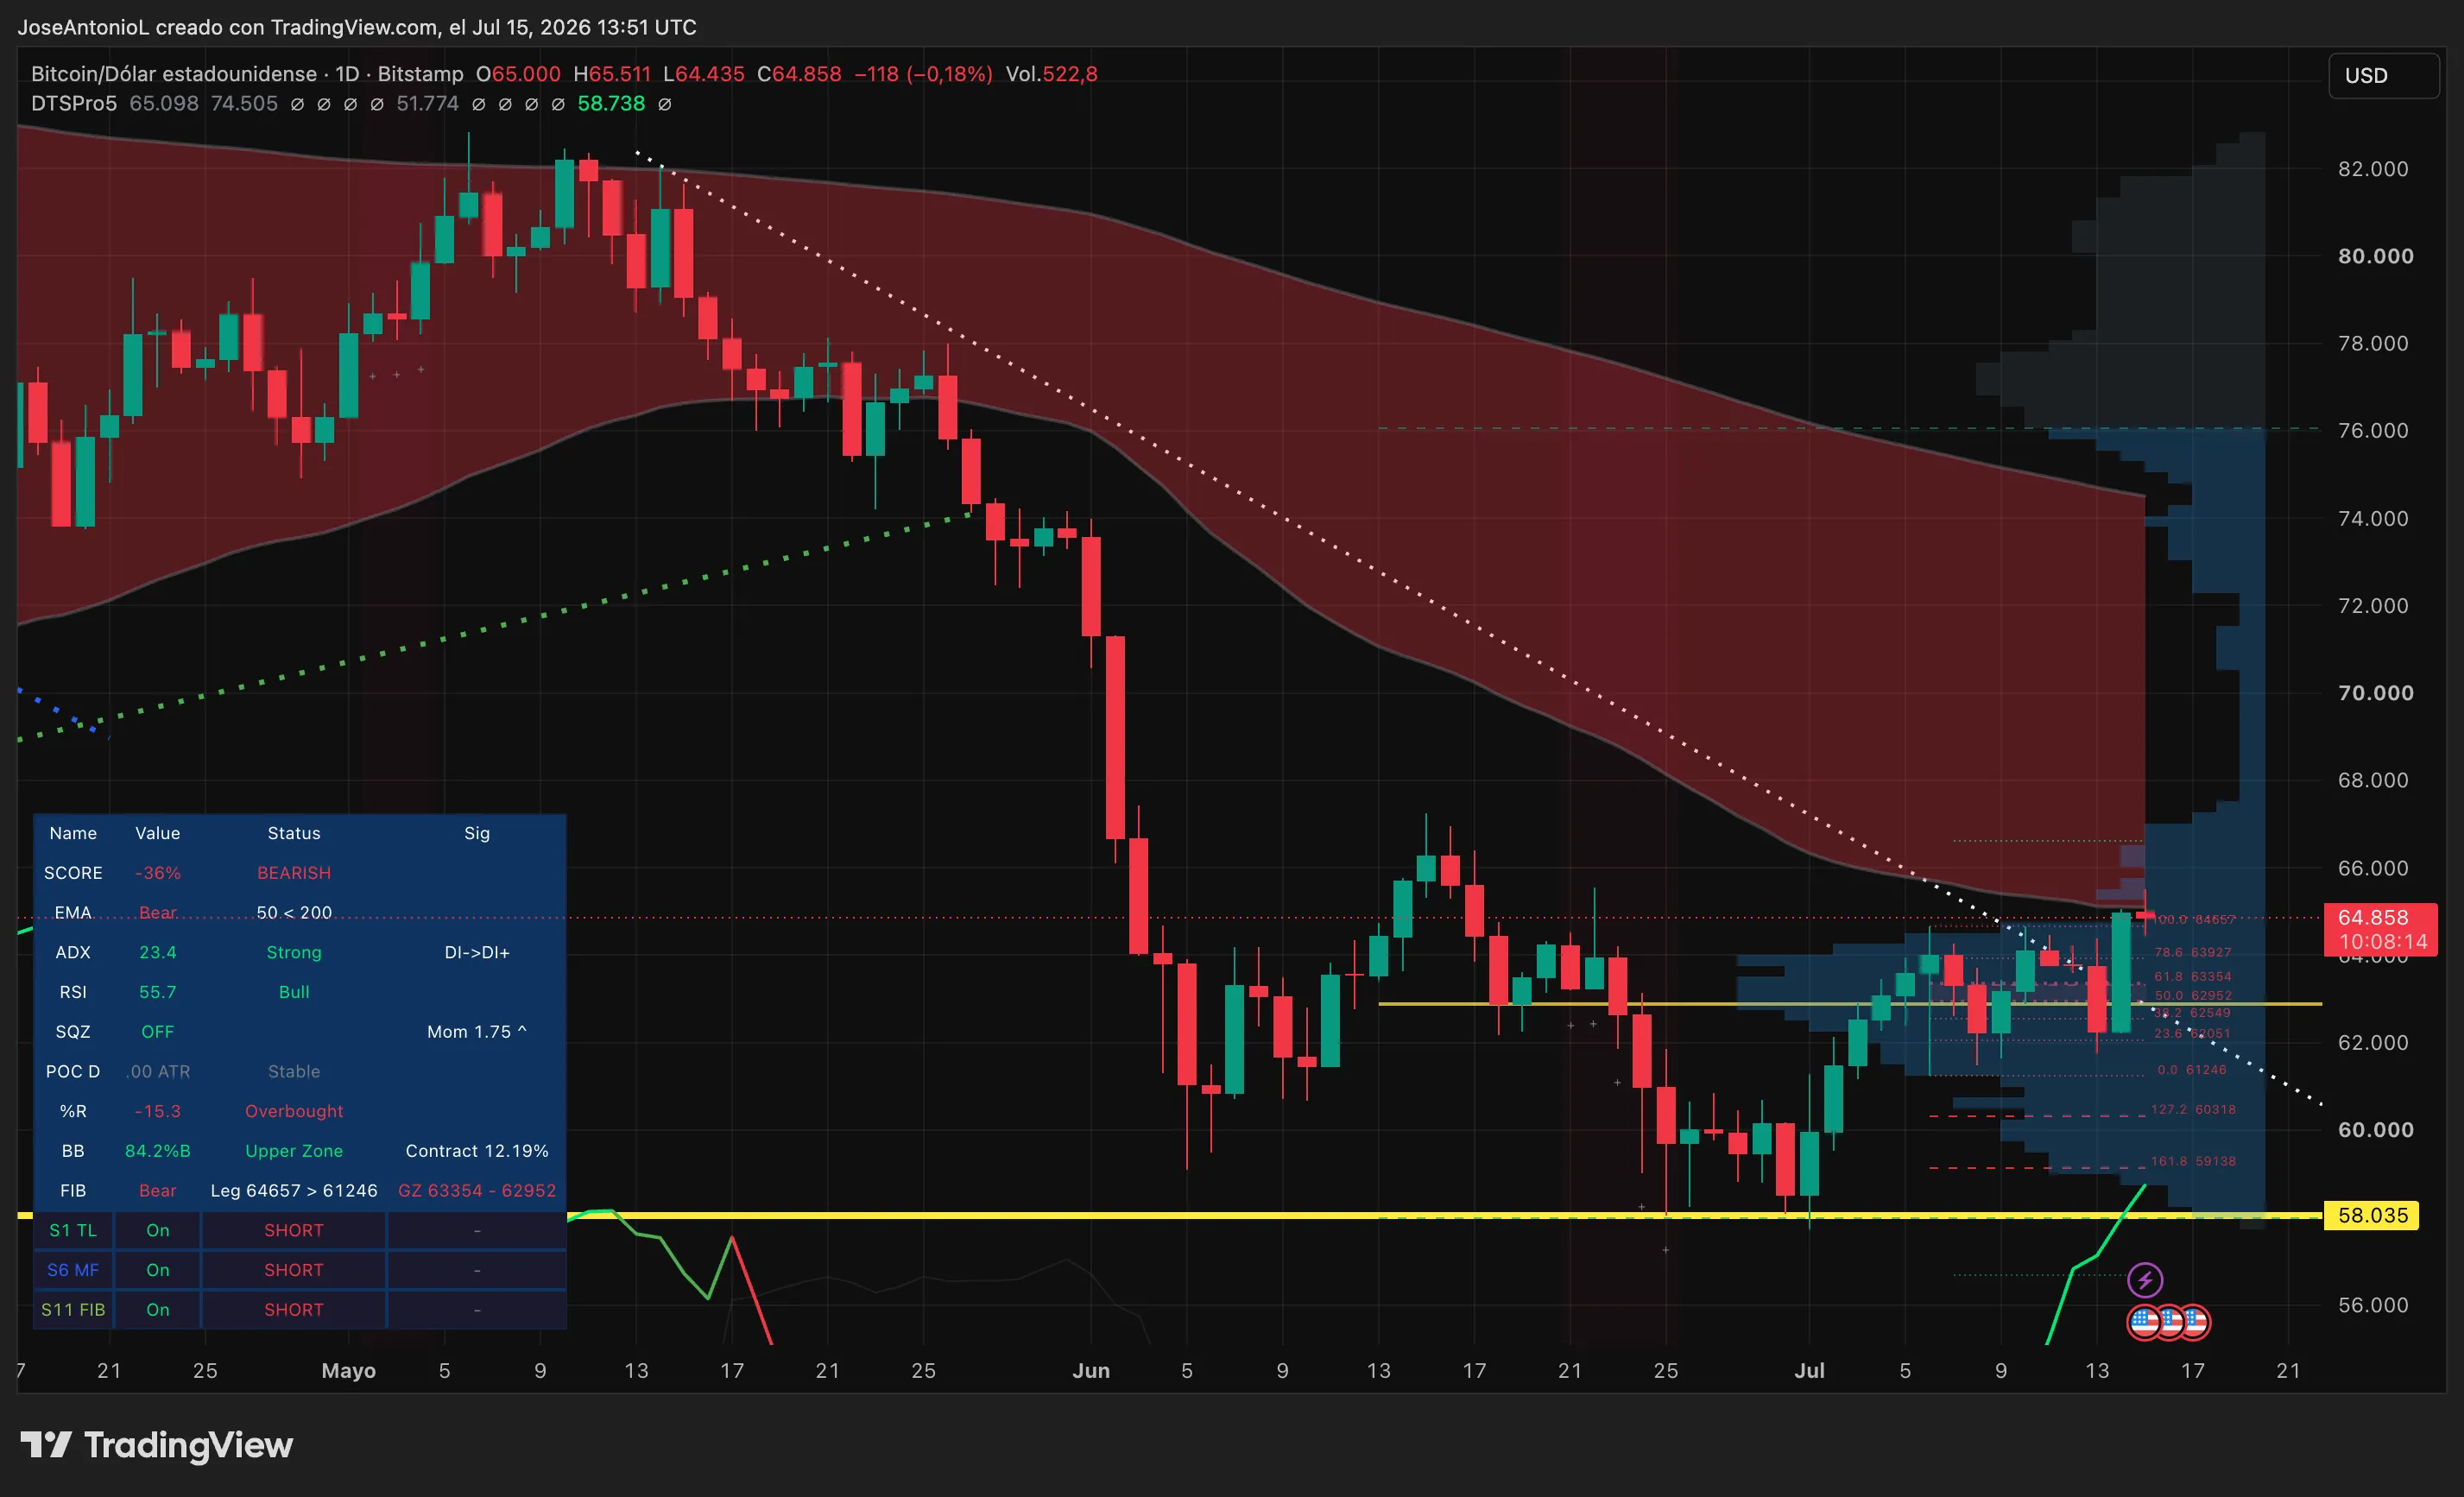
A look at the daily chart reveals that Bitcoin is barely escaping a descending trend channel that has governed its price action since its May highs near $82,000. This channel is characterized by a series of lower highs and lower lows, with a descending trendline acting as overhead supply. While the current price sits slightly above this boundary, it remains highly vulnerable; a mere 5% pullback would drag Bitcoin back into the channel, handing control back to market bears.
Furthermore, the broader technical structure remains structurally bearish. The aggregate technical indicator score sits at -36%, heavily weighted by the formation of a death cross on the daily chart. A death cross occurs when an asset’s short-term moving average—specifically the 50-day simple moving average—crosses below its long-term 200-day moving average. This is widely regarded by technical analysts as a reliable indicator of a long-term bearish regime, and currently, there are no technical signs that the gap between these two moving averages is beginning to contract.
To gauge the strength of the current trend, traders look to the Average Directional Index, or ADX, which currently sits at 23.4. The ADX measures the strength of a trend on a scale from 0 to 100, regardless of its direction. Typically, a reading below 25 indicates a weak, choppy, or range-bound market, while a reading above 25 suggests a strong trending environment. While the current reading of 23.4 indicates that the prevailing bearish trend is losing its grip, it also suggests that a strong bullish trend has not yet been established. However, there is a silver lining for bulls: the directional movement indicators are undergoing a transition, shifting from Di- (bearish dominance) to Di+ (bullish dominance), signaling a potential regime shift in progress.
Meanwhile, the Relative Strength Index (RSI) is hovering at 55.7. This puts the momentum oscillator in neutral-to-slightly-bullish territory, leaving ample room for the price to run upward before reaching the overbought threshold of 70. Additionally, while the Squeeze Momentum Indicator remains off, upward momentum is building at 1.75. When a squeeze release occurs, it typically triggers a sharp, explosive price expansion, though the indicator itself does not predict the direction of the breakout.
The Case for the Bulls
Those arguing for a sustained upward move point directly to the improving macroeconomic environment. Easing inflation, robust corporate earnings, and a central bank that appears finished with its aggressive rate-hiking cycle create an ideal environment for risk-on liquidity to expand.
Beyond macroeconomics, the digital asset space continues to gain high-profile attention. In a sign of growing mainstream political integration, Eric Trump, the son of the President of the United States, recently drew attention by openly promoting Ethereum on social media, highlighting the asset class’s ongoing appeal to politically connected and high-net-worth figures.
ETH is pumping hard! Great to see!
Crypto is the future… pic.twitter.com/eROvMAqxlZ
— Eric Trump (@EricTrump) July 11, 2026
If Bitcoin can successfully consolidate and hold the $64,000 level as support over the coming sessions, technical analysts point to immediate upside targets between $66,500 and $67,600, with a psychological test of $70,000 becoming plausible if buying momentum intensifies.
Why the Bears Remain Skeptical
Despite the optimistic macro picture, bearish traders have technical history on their side. According to Fibonacci analysis, the asset is currently trading directly at the 100% retracement level of a recent bearish leg that saw prices drop from $64,657 down to $61,246. This 100% extension level is a common area for sellers to step back into the market and defend their positions. While Bitcoin did manage to clear the high-volume “golden zone” (the 50% to 61.8% retracement level spanning $62,952 to $63,354) on its way up, this zone now serves as the first line of critical support should the bulls lose their grip.
This cautious outlook is mirrored in sentiment data. On Myriad, a prediction market developed by Decrypt’s parent company Dastan, participants are largely dismissing the breakout narrative.
Traders on the prediction market have priced in a 66.6% probability that Bitcoin will decline to $55,000 before it reaches $84,000 again, leaving just a 33.4% probability for the bullish scenario. Notably, these odds have remained stubborn and have not adjusted upward despite Bitcoin’s recent price gains. This 2-to-1 bearish bias suggests that crowd sentiment remains highly skeptical of the current rally, particularly as Myriad participants have recently demonstrated a highly accurate track record in anticipating Bitcoin’s directional swings.