
Bitcoin Metric That Signaled Prior Cycle Lows Points to Looming Macro Bottom
Onchain data reveals over half of Bitcoin supply was recently held at a loss, triggering a historical countdown to the market floor.
Bitcoin is currently navigating a critical phase of its market cycle, with a key onchain metric indicating that the cryptocurrency has been in a countdown toward its next macro price bottom for several weeks.
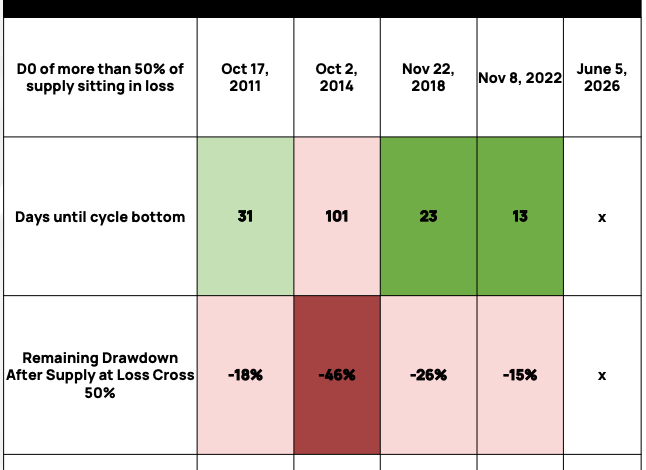
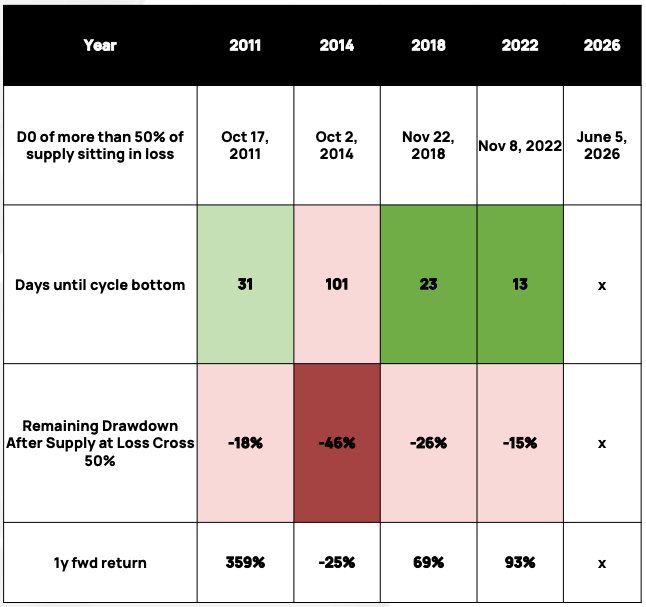
According to the H1 2026 Round-Up report by digital asset research firm K33 Research, more than 50% of the total Bitcoin supply was held at a loss starting on June 5, 2026. Historically, this “supply in loss” threshold has served as a reliable indicator that the market is approaching the absolute floor of a bearish cycle.
In previous market downturns, once the proportion of Bitcoin supply held at a loss crossed the 50% mark, a macro price bottom was established in relatively short order. Historically, this capitulation window has never exceeded 101 days.
During the 2022 bear market, the bottom was reached just 13 days after crossing this threshold. In 2018, the process took 23 days, while the 2014 cycle saw the longest stretch, with Bitcoin continuing to slide for 101 days before finding its ultimate floor.
As of mid-July, 42 days have elapsed since the 50% mark was breached on June 5. This makes the current cycle’s countdown the second-longest in Bitcoin’s history, trailing only the 2014 bear market. Despite the prolonged wait, K33 Research pointed out that historical data remains highly encouraging, noting that overall returns in the 12 months following this capitulation signal “tend to be very solid.”
This assessment aligns with observations from other industry analysts. Earlier in July, Axel Adler Jr., a researcher at the onchain analytics platform CryptoQuant, estimated that the market was roughly two months away from reaching levels typical of a definitive bear-market bottom. As of July 17, data from CryptoQuant indicated that the supply in loss stood at 46%, suggesting slight fluctuations as the market consolidates.
To understand these dynamics, it is helpful to look at how onchain analysts evaluate market value. Unlike traditional financial markets, blockchain networks allow researchers to track the exact price at which every coin last moved. This metric, known as the realized cap, represents the collective acquisition cost of all outstanding Bitcoin, offering a more stable measure of network value than the highly volatile market capitalization.
When market prices fall significantly below the aggregate acquisition cost, a large portion of the supply enters a state of unrealized loss. This phase of the market cycle often forces speculative retail investors to capitulate, transferring supply to long-term holders who are willing to weather the downturn.
Further supporting the thesis that the market is in its final capitulation phase is the realized cap variance (RCV) model. This metric evaluates the difference between the realized cap and the standard market capitalization relative to its historical rolling average, highlighting how compressed or stretched the investor cost basis has become compared to current market valuations.
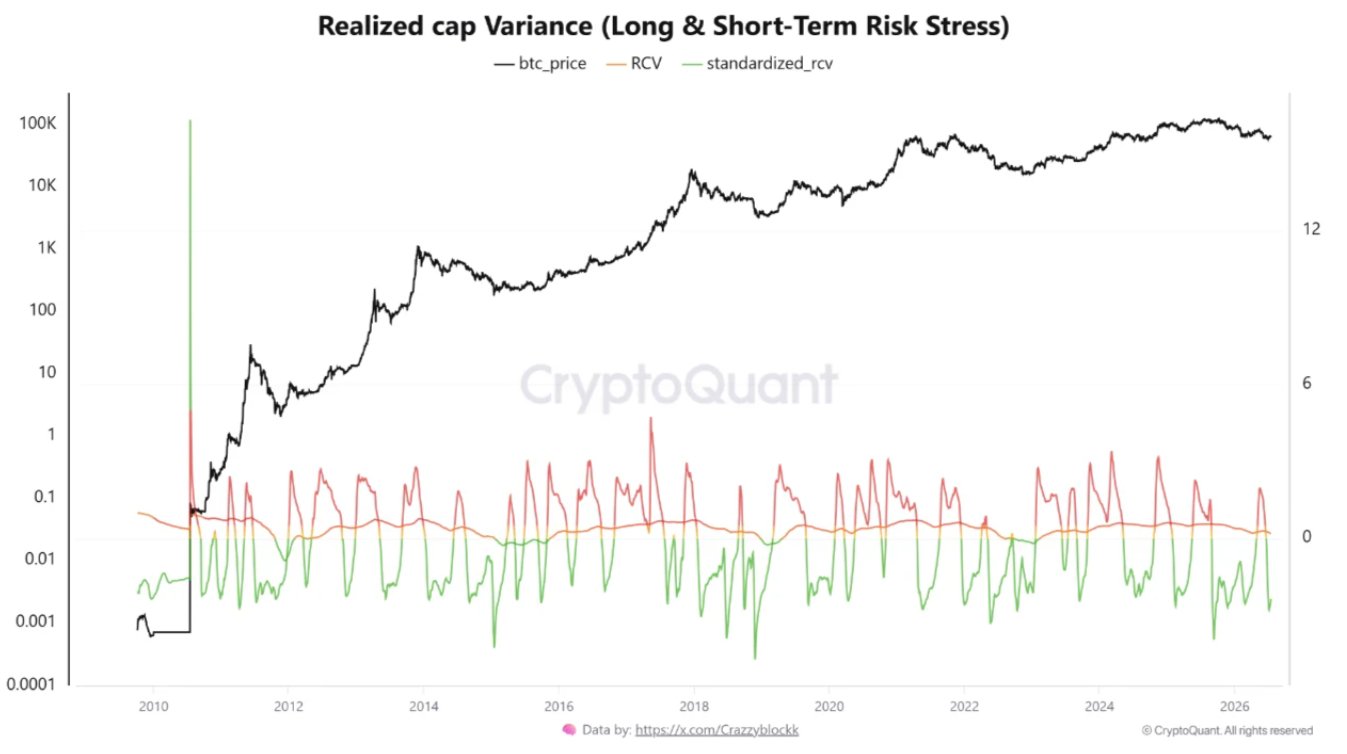
According to CryptoQuant contributor Crazzyblockk, the standardized Z-score of the realized cap variance model has dropped to -2.35, placing it within the bottom 6% of its historical range.
Historically, such deeply negative readings have heralded the final stages of a bear market. Crazzyblockk noted in a QuickTake blog post that every prior instance where this metric spent an extended period below the -2.0 threshold—specifically in late 2018, mid-2022, and early 2015—was followed by substantial market recoveries, with 12-month forward returns exceeding 75%.