
Bitcoin Slips Below $62,500 as Geopolitical Tensions and Tech Sell-Off Rattle Markets
Geopolitical conflict and disappointing corporate earnings trigger a risk-off wave, dragging down crypto and equities alike.
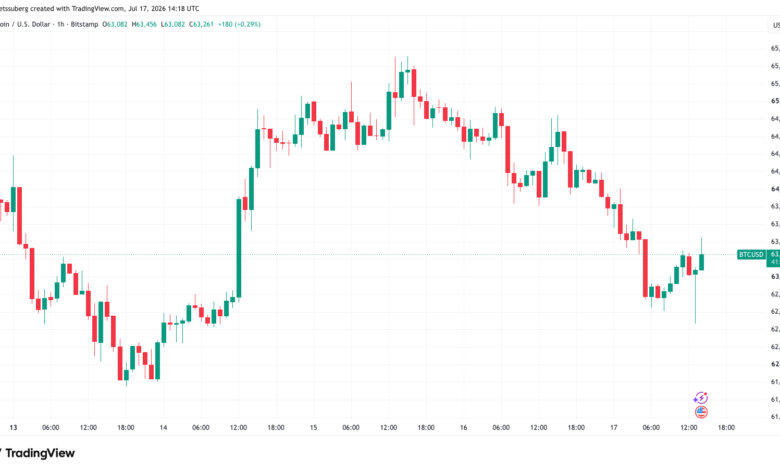
Geopolitical tensions and corporate earnings disappointments collided on Friday, sending both digital assets and traditional equities lower. At the opening bell on Wall Street, Bitcoin (BTC) slipped below the $62,500 threshold, erasing recent gains as a fresh wave of risk-off sentiment swept through global financial markets.
The primary catalyst behind the sudden market retreat was an escalation in the US-Iran war, which saw new military strikes fuel anxiety across trading desks. As geopolitical uncertainty intensified, investors rapidly de-risked, hitting both cryptocurrency markets and traditional equities. The tech-heavy Nasdaq Composite Index fell by nearly 2% shortly after the opening bell, dragged down by broader macroeconomic concerns and persistent selling pressure targeting high-growth tech stocks.
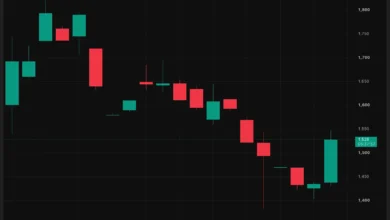
Adding to the bearish sentiment was a rocky start to the corporate earnings season. Financial commentary outlet The Kobeissi Letter highlighted notable weakness in the equity space, pointing to disappointing earnings reports. Netflix (NFLX), in particular, suffered a severe blow, with its stock shedding over 10% at the start of the US session. “The stock is now down -50% over the last 12 months and trading at its lowest level since August 2024,” it noted in a post on X.
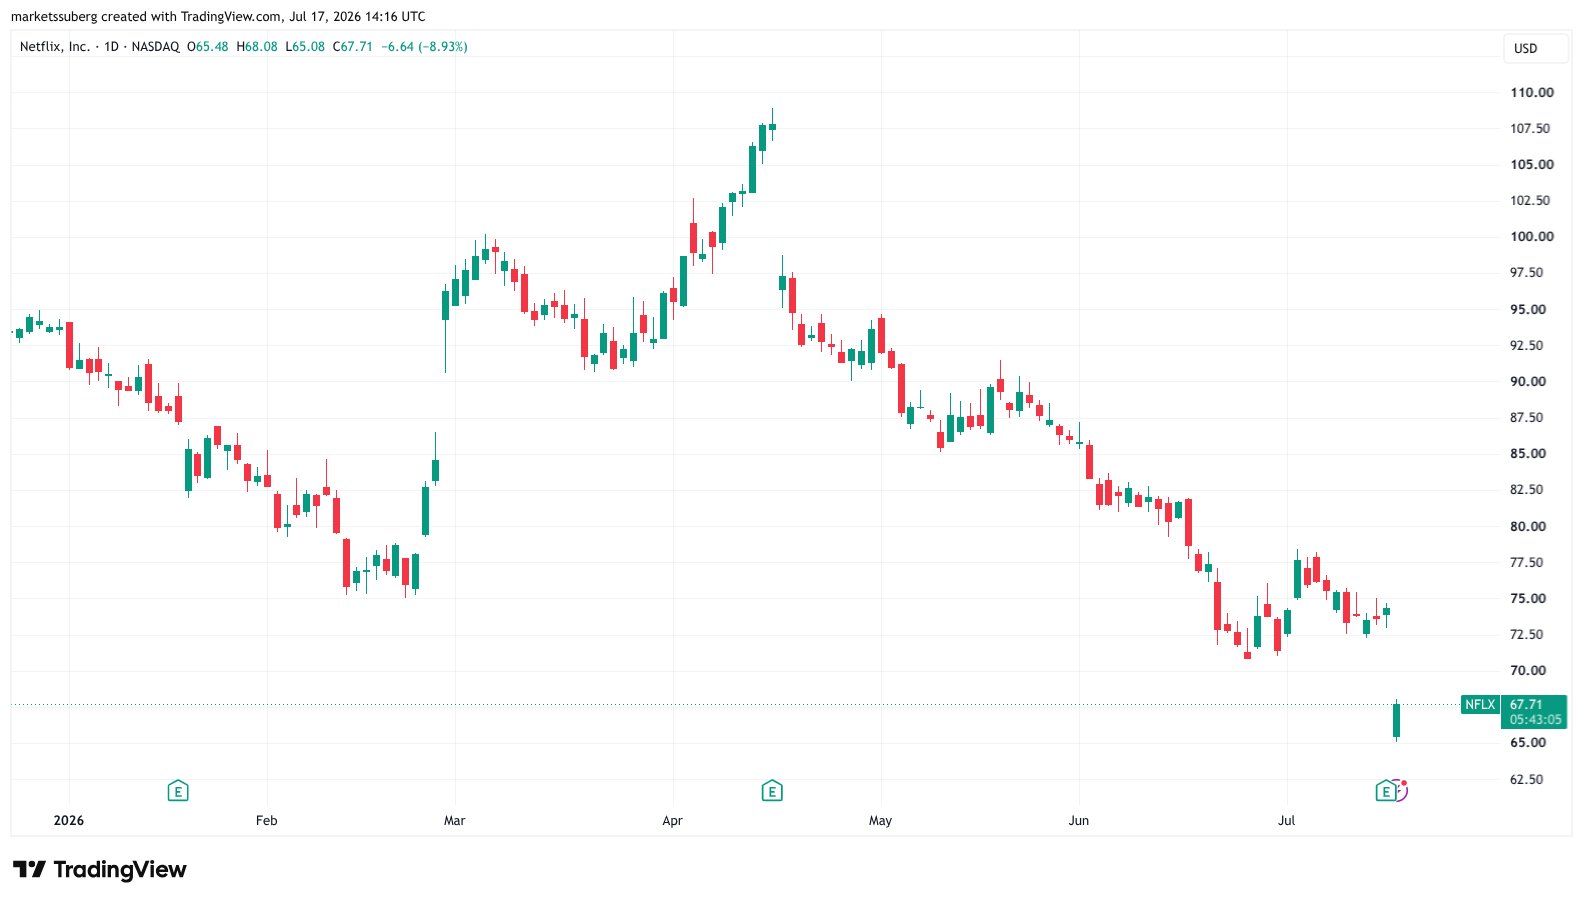
Netflix stock one-day chart. Source: Cointelegraph/TradingView
For Bitcoin, the sudden downturn marked a return to familiar territory, cutting short a brief climb to three-week highs. The rejection at local resistance levels left market participants experiencing a sense of déjà vu, as the cryptocurrency once again failed to sustain its upward momentum.
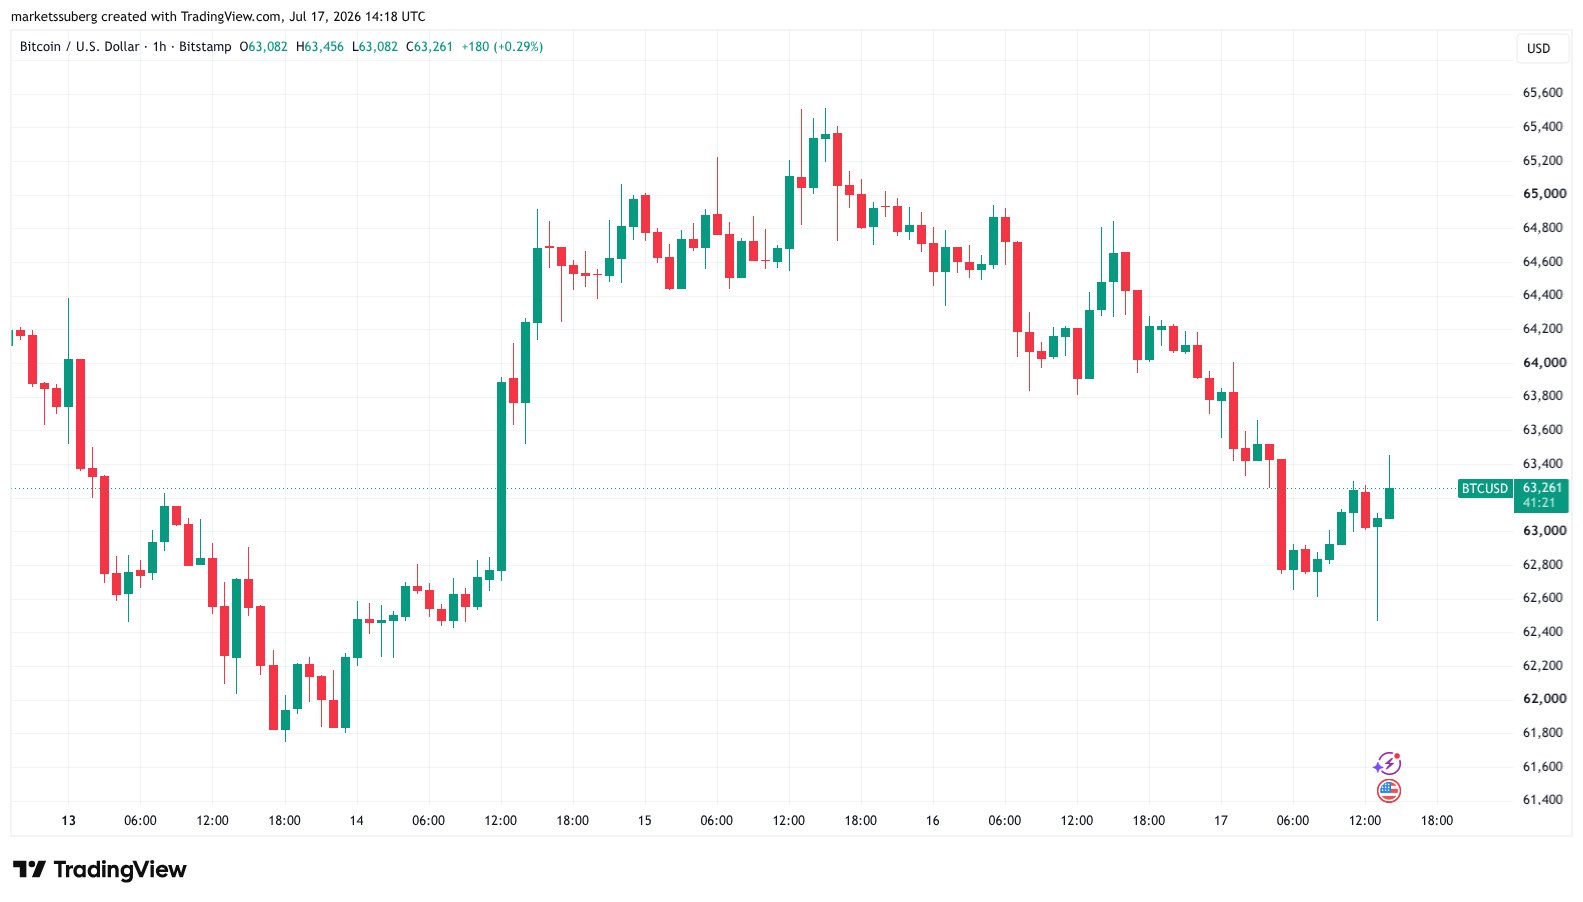
BTC/USD one-hour chart. Source: Cointelegraph/TradingView
Crypto market commentator Exitpump observed that the asset class is locked in a repetitive cycle, writing on X that the “Market just keeps repeating same things.” This pattern of brief breakouts followed by sharp rejections has characterized much of Bitcoin’s recent price action, keeping the market trapped in a series of rangebound moves.
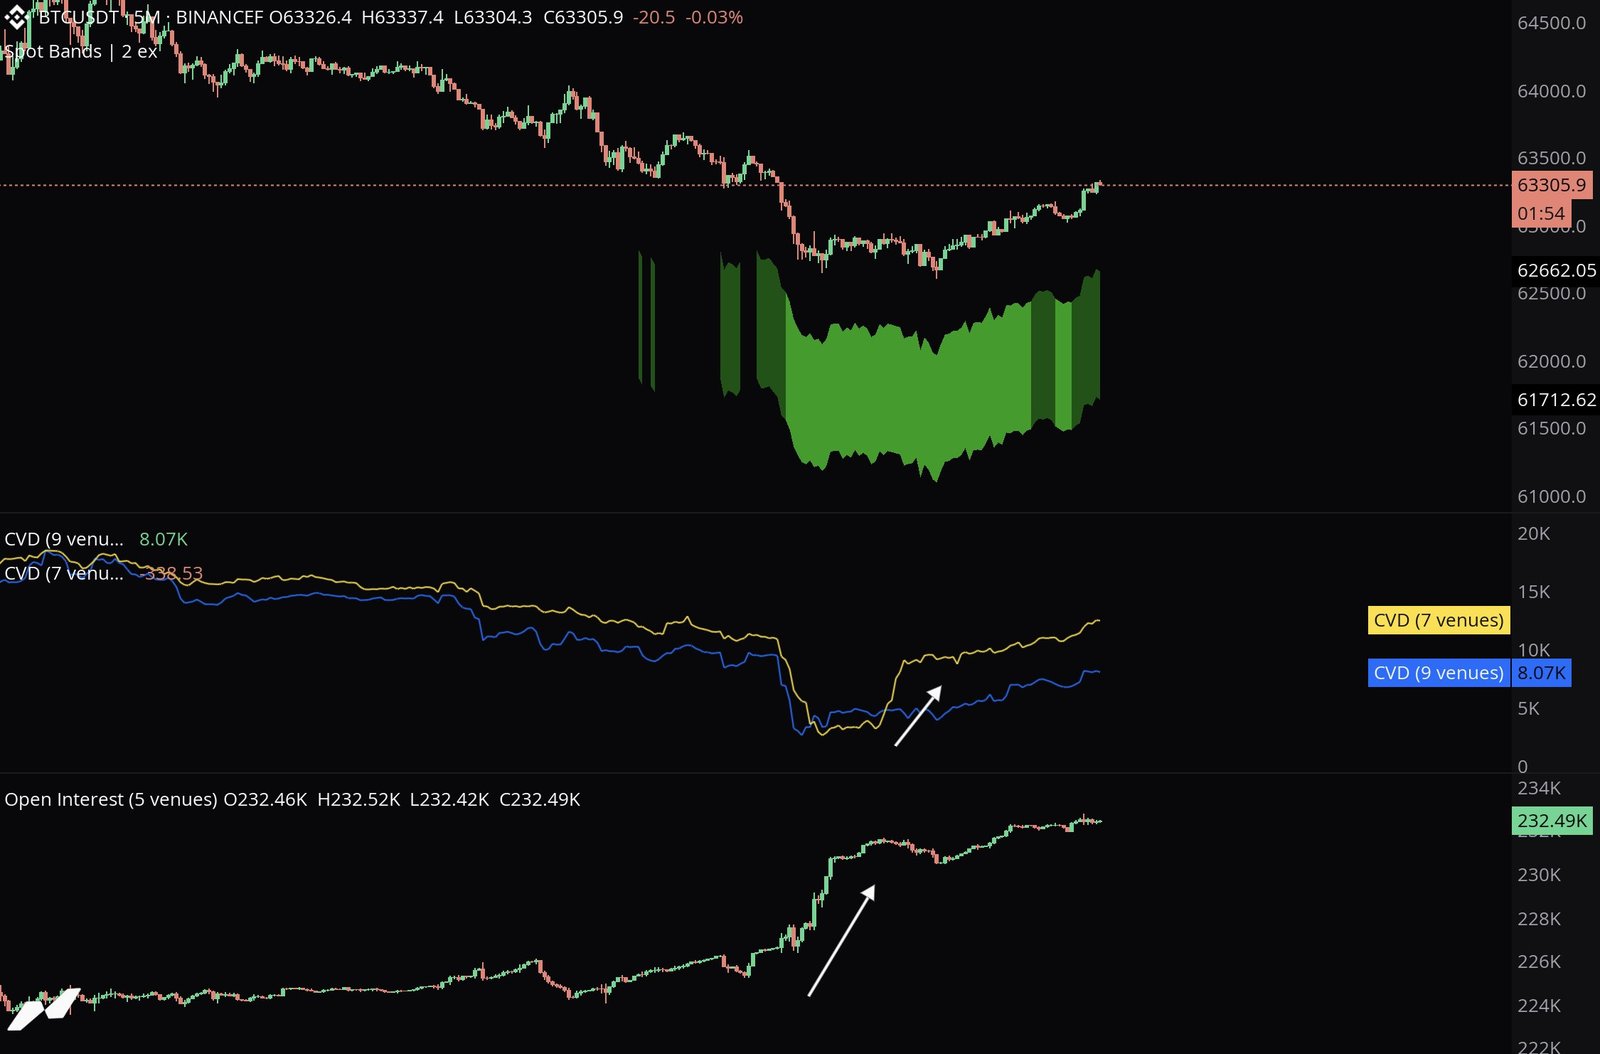
BTC/USDT five-minute chart with order-book data. Source: Exitpump/X
Analyzing the order-book data from major exchanges reveals heavy overhead resistance, which has repeatedly capped upward advances and forced liquidations of overleveraged long positions.
Other market participants view this lack of direction as typical seasonal behavior. Popular trader Daan Crypto Trades suggested that the current environment is characteristic of the summer months, which historically see lower trading volumes and reduced liquidity. “Very choppy few days up, few days down kind of price action the last few weeks. No real action anywhere really,” he summarized, pointing to the lack of a decisive trend.
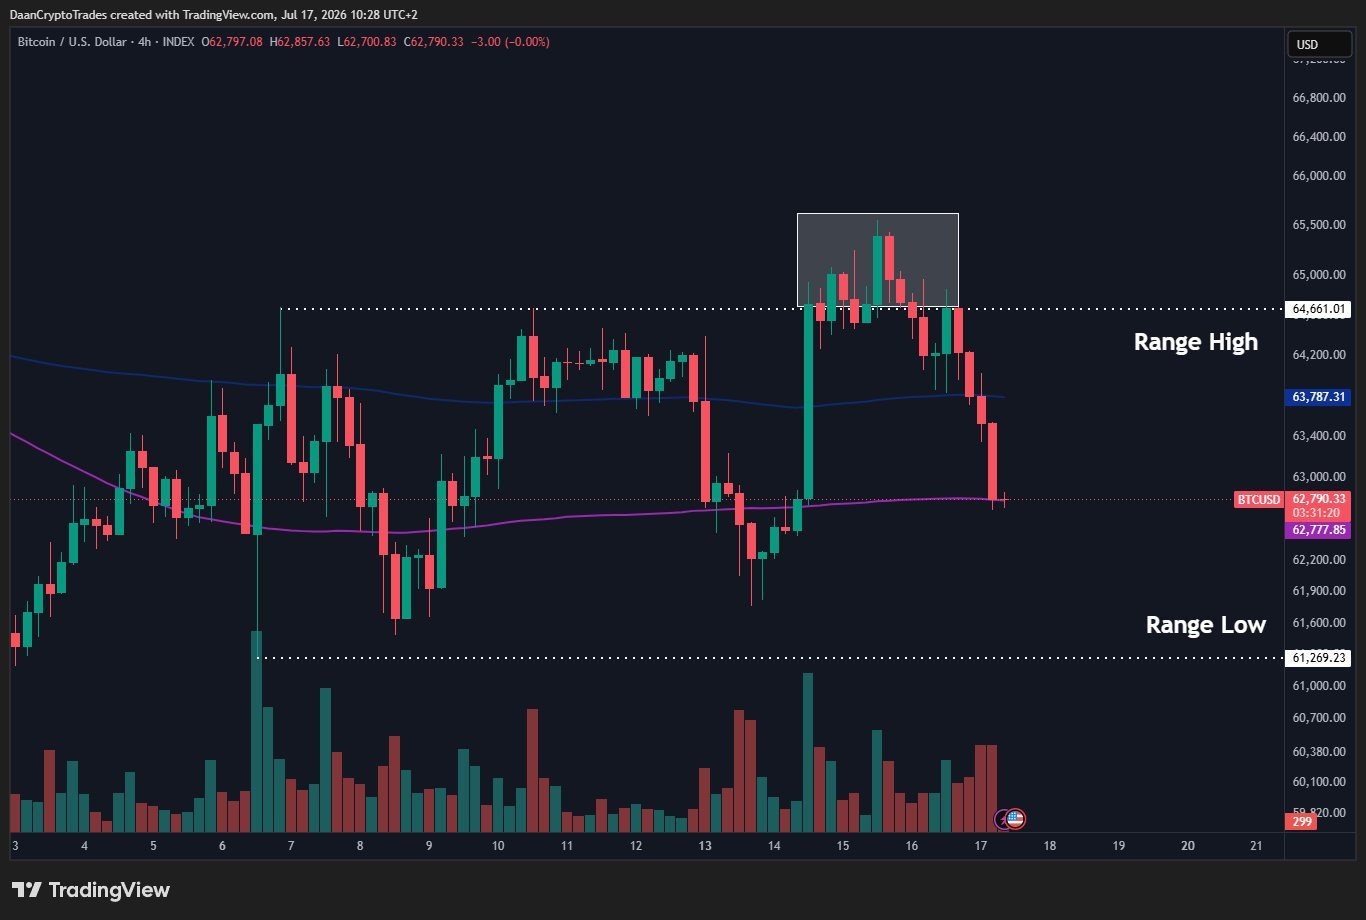
BTC/USD four-hour chart. Source: Daan Crypto Trades/X
Despite the short-term choppiness, some analysts maintain a cautiously optimistic outlook for the weeks ahead. Trader Jelle highlighted that key range lows continue to hold, suggesting that the structural foundation for a temporary bounce remains intact. “Still think this looks good for a relief rally in the next weeks – which would give the market room to drop into October without nuking much deeper,” he shared with his followers on X.
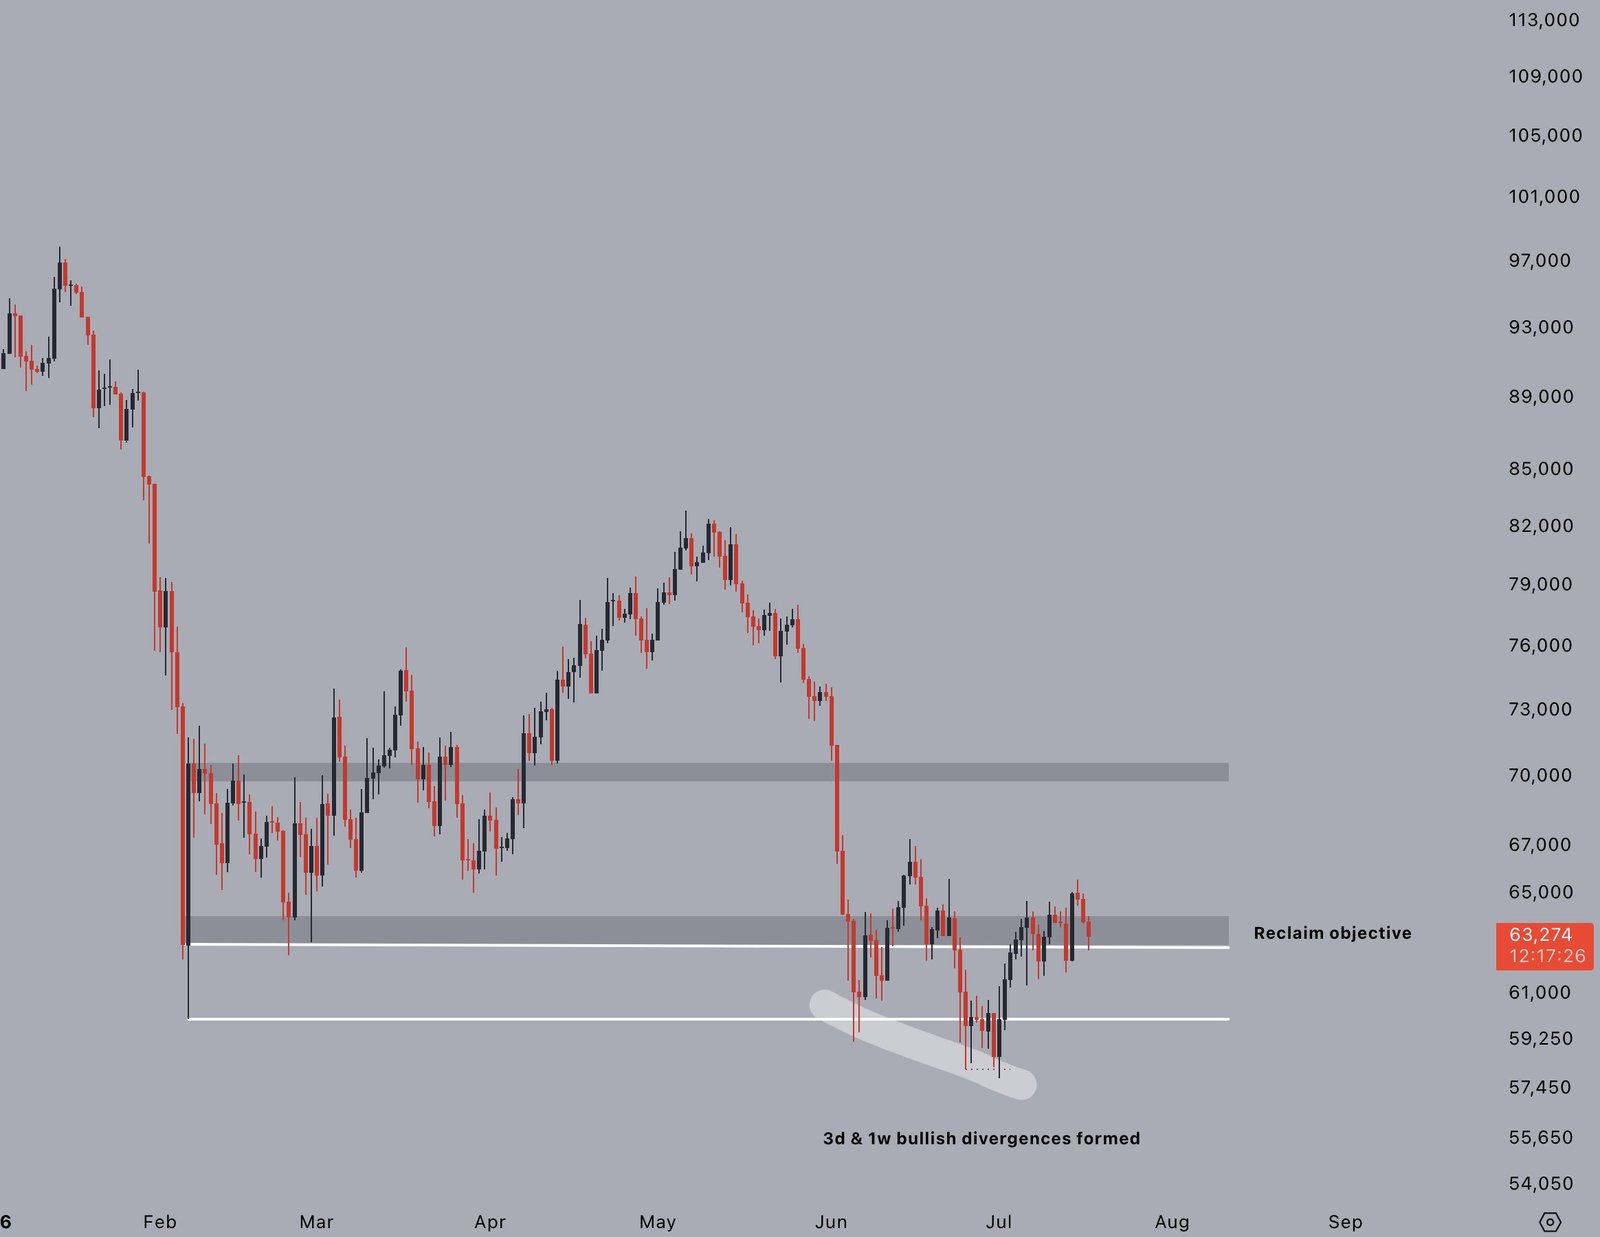
BTC/USD one-day chart. Source: Jelle/X
A potential short-term relief rally could offer temporary respite, but longer-term technical indicators paint a more sobering picture. Well-known trader and analyst Rekt Capital suggested that Bitcoin’s macro downtrend is entering its final, capitulatory stages. According to his analysis, Bitcoin has flipped its 50-month exponential moving average (EMA) into a formidable level of resistance.
In technical analysis, the 50-month EMA serves as a crucial gauge of long-term market health. Flipping this level from support to resistance is a significant milestone that has historically signaled the final phase of a macro downtrend. Rekt Capital noted that this development aligns with established bear-market history, paving the way for Bitcoin to establish a definitive long-term cycle floor.
“The necessary technical milestone has been achieved,” Rekt Capital confirmed, pointing to historical charts.
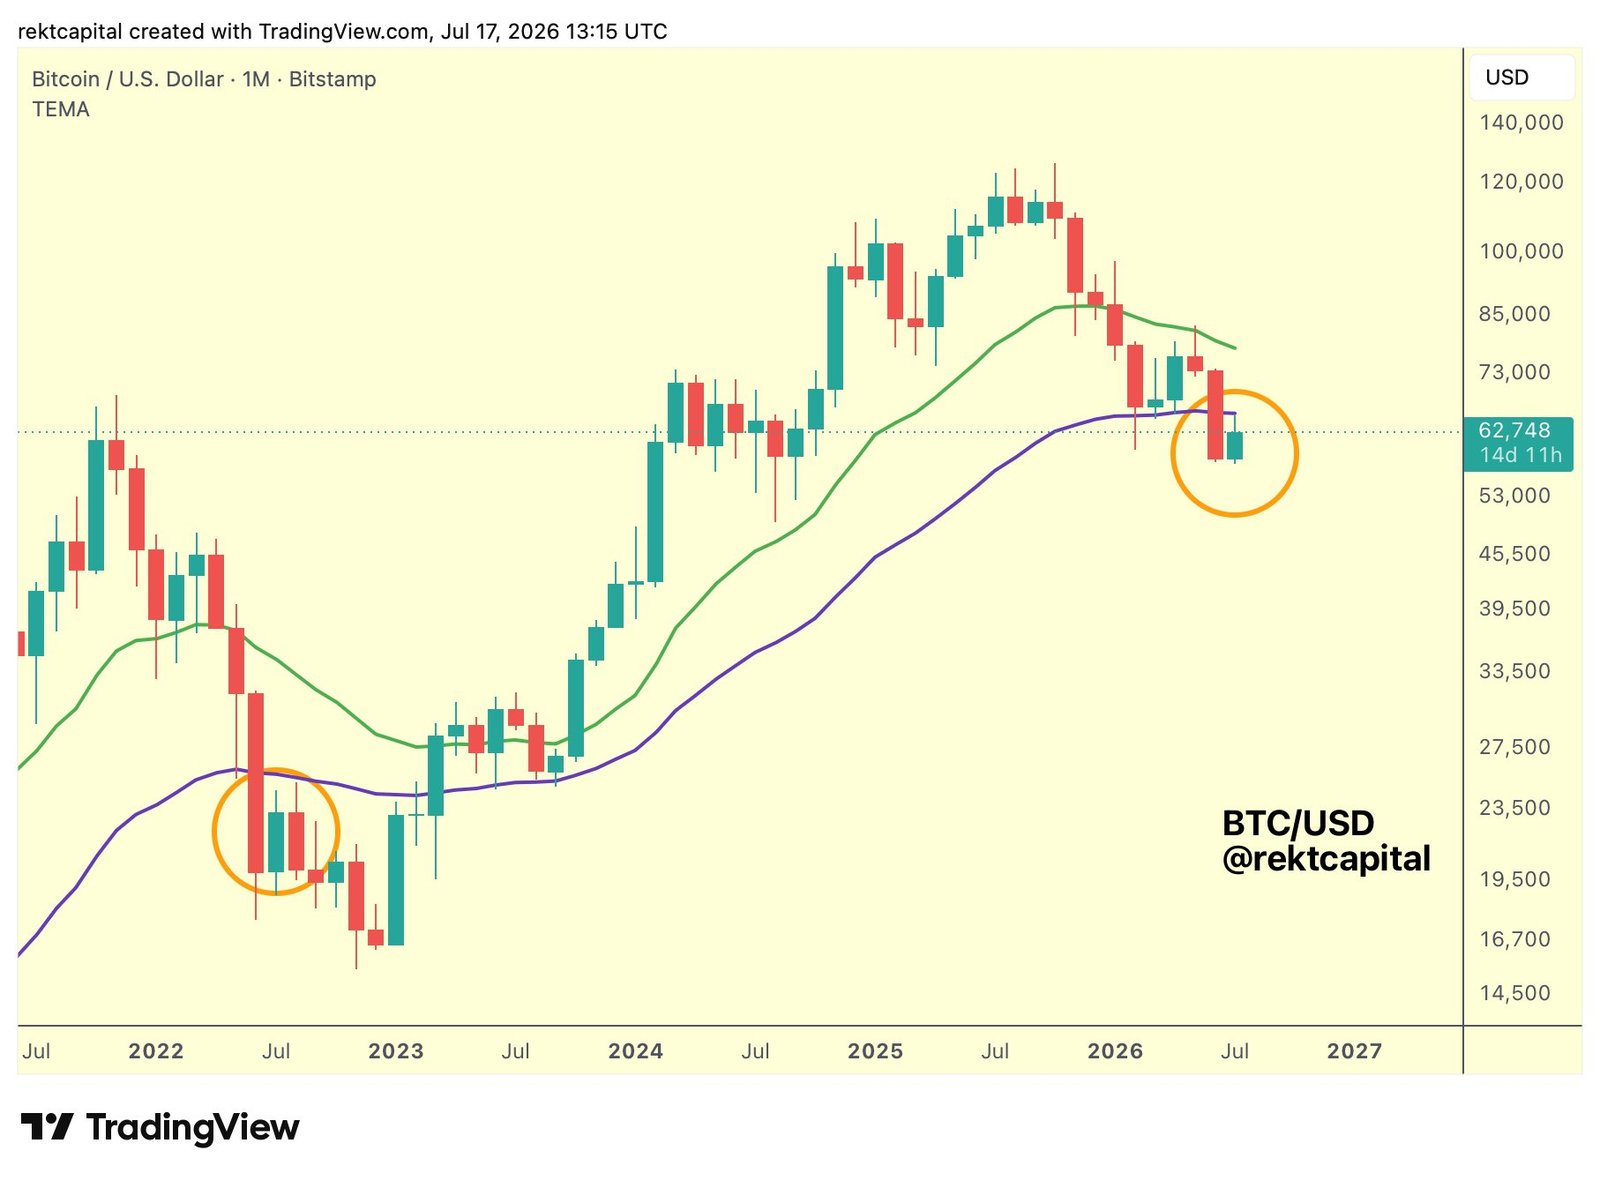
BTC/USD one-month chart with 21, 50EMA. Source: Rekt Capital/X
As previously reported, this technical setup suggests that while a brief relief bounce could characterize the remainder of July, the market may face renewed downward pressure as August approaches, keeping traders on high alert.