
XRP Lags Behind as Macro-Driven Crypto Rally Cools and Key Legislative Catalyst Delays
XRP trades flat at $1.10, locked in a daily death cross, as the critical Senate vote on the Clarity Act slips to late summer.
The digital asset market is catching its breath on Thursday following one of the most convincing macro-driven rallies of 2026. A wave of positive macroeconomic data and strong corporate earnings earlier in the week injected fresh capital into risk assets, sending major cryptocurrencies on a decisive upward run before settling into an orderly consolidation.
The primary catalyst for the market’s bullish shift was the latest inflation print. The June Consumer Price Index fell 0.4%—marking the steepest single-month decline since April 2020. This unexpected cooling of inflationary pressures fundamentally altered market expectations, collapsing the implied odds of a Federal Reserve rate hike in July from 31% down to the single digits. Traditional equities surged on the news, and the cryptocurrency market quickly followed suit.
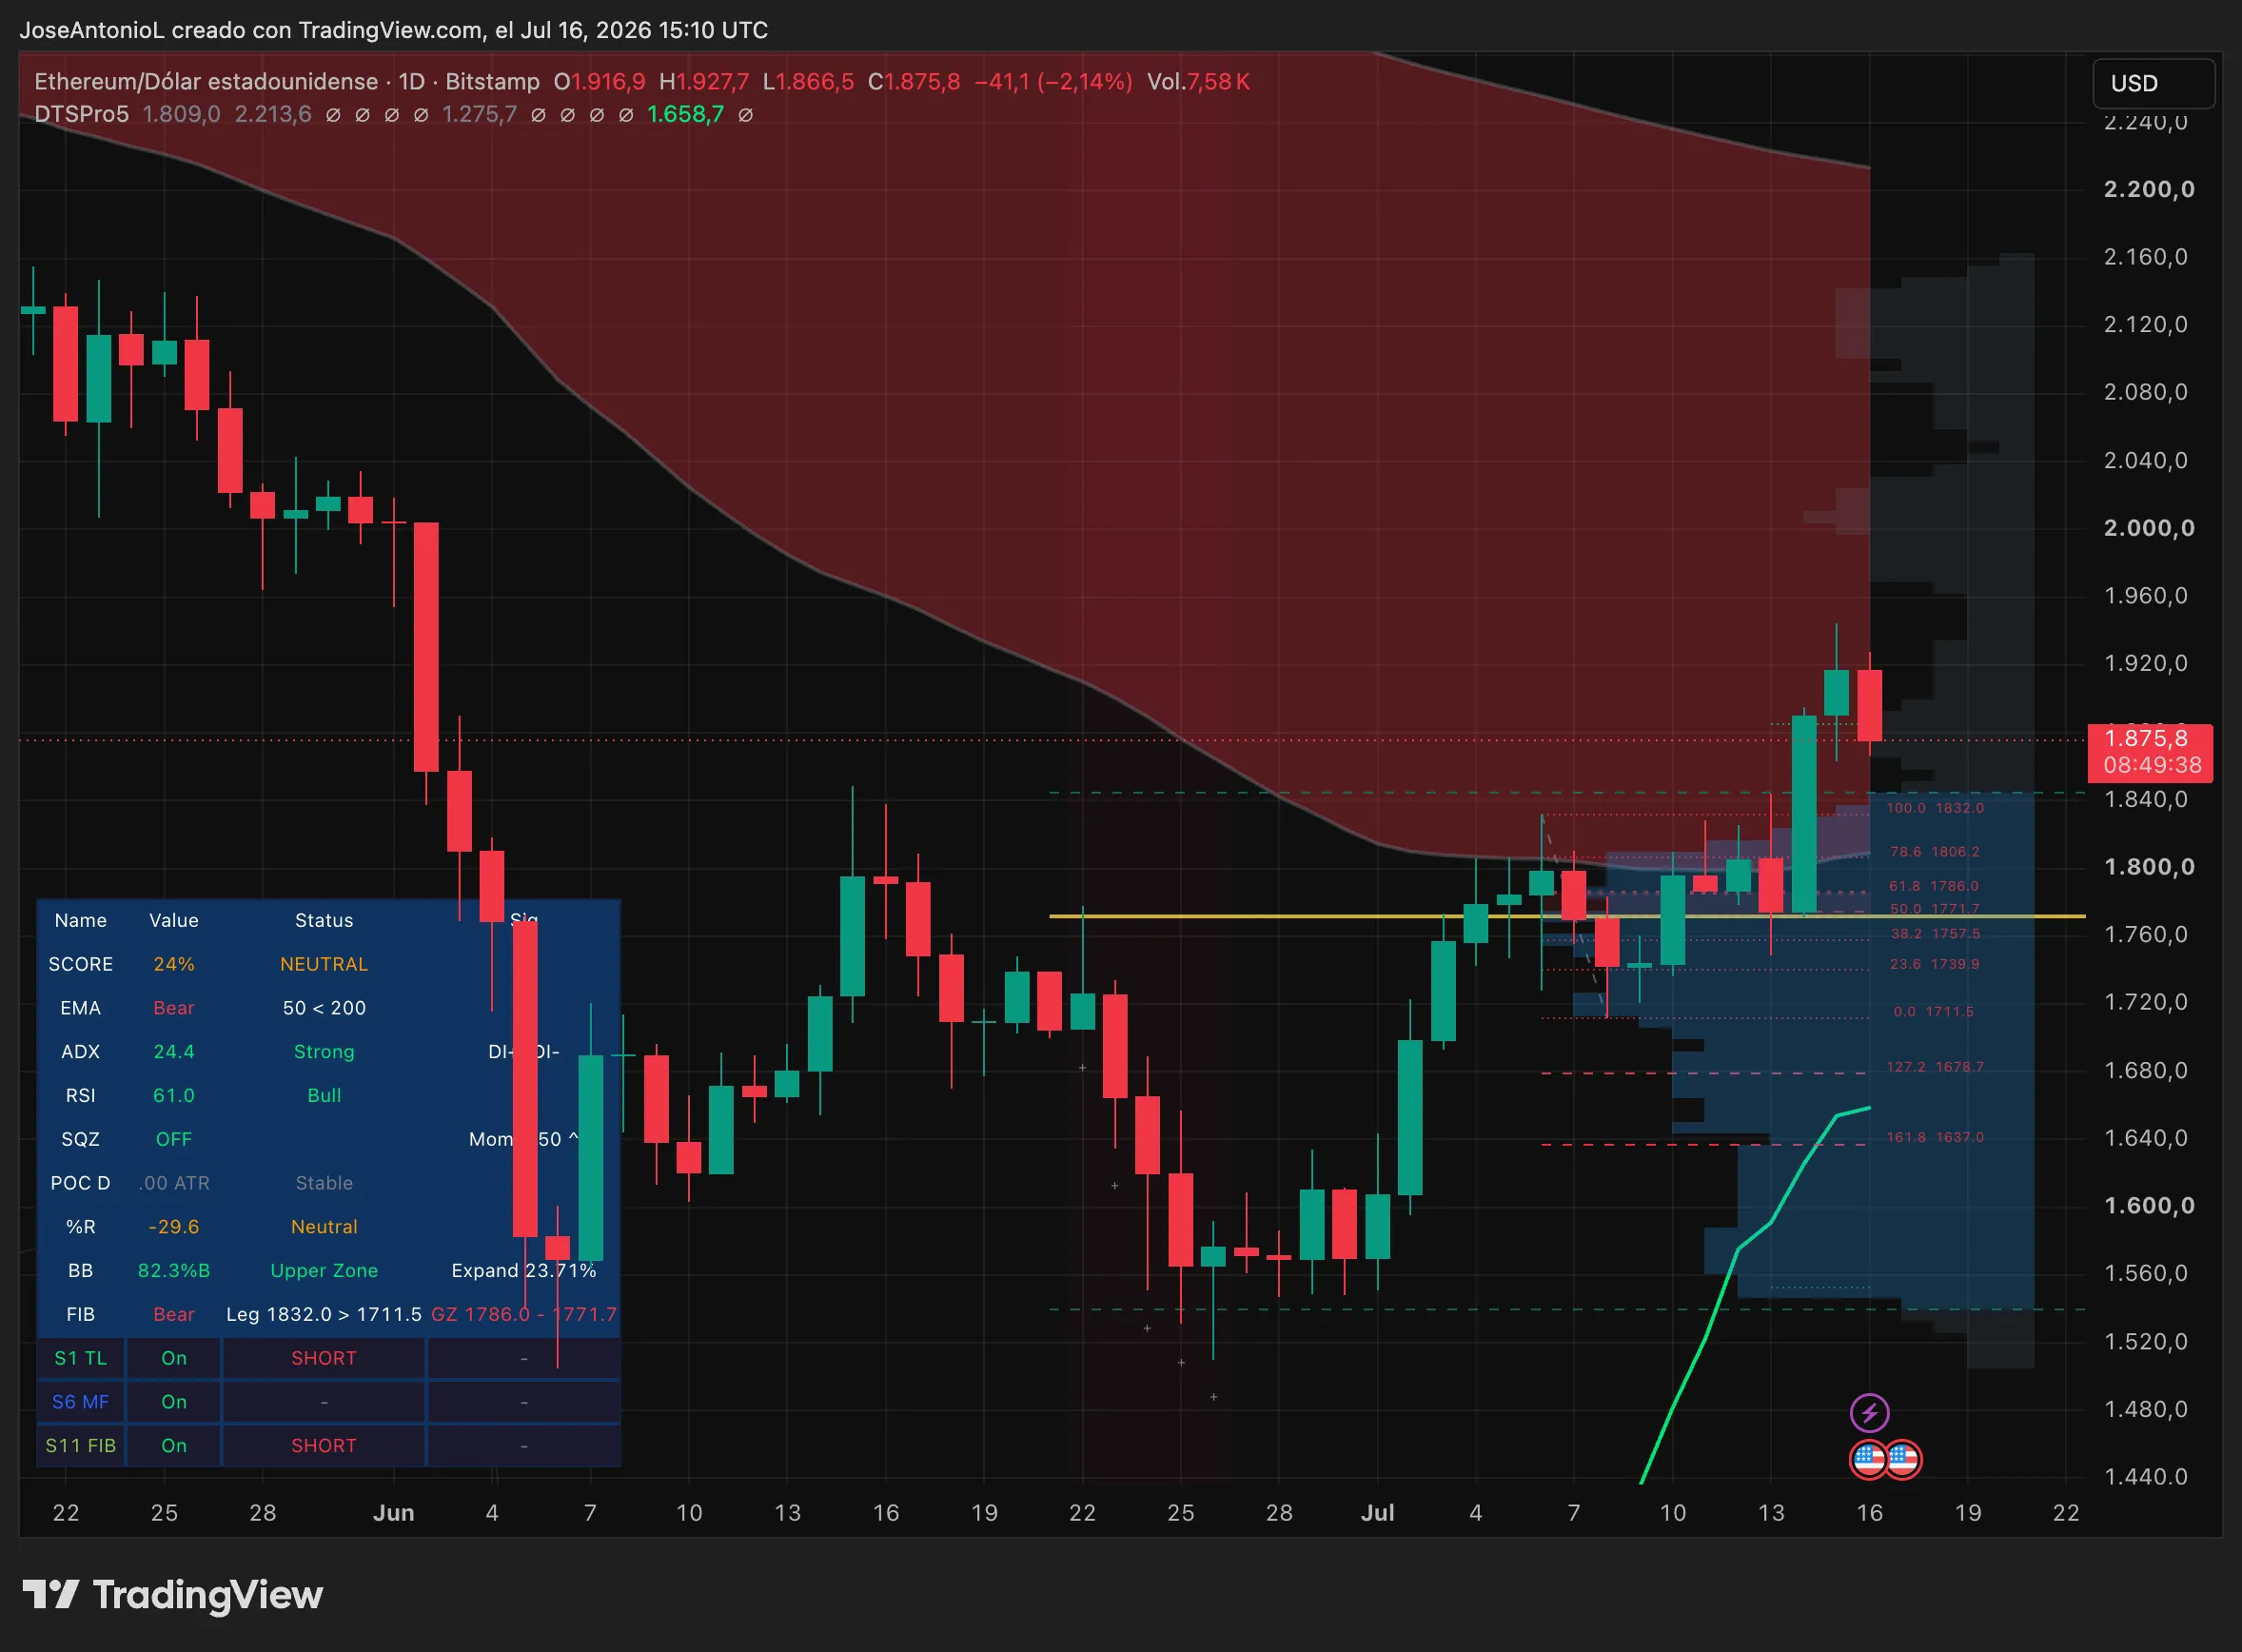
Adding to the positive sentiment, Wall Street’s heavyweight financial institutions delivered strong quarterly performances. Goldman Sachs, JPMorgan, Morgan Stanley, and Citi all posted second-quarter earnings that beat consensus expectations, signaling broader economic resilience. In response to this supportive backdrop, Bitcoin broke through the key $64K resistance level that had capped its price action for weeks, eventually clearing $65K. Ethereum exhibited even greater relative strength, surging nearly 6% in a single day to touch $1,900.
Thursday’s minor pullback represents a healthy consolidation phase rather than a trend reversal, with the majority of the top 50 coins by market capitalization shedding less than 3%. Ondo stands out as the sole major exception to this minor retracement. Up over 14%, Ondo led the entire top 100 assets by market capitalization, propelled by sustained momentum in the real-world asset (RWA) tokenization sector.
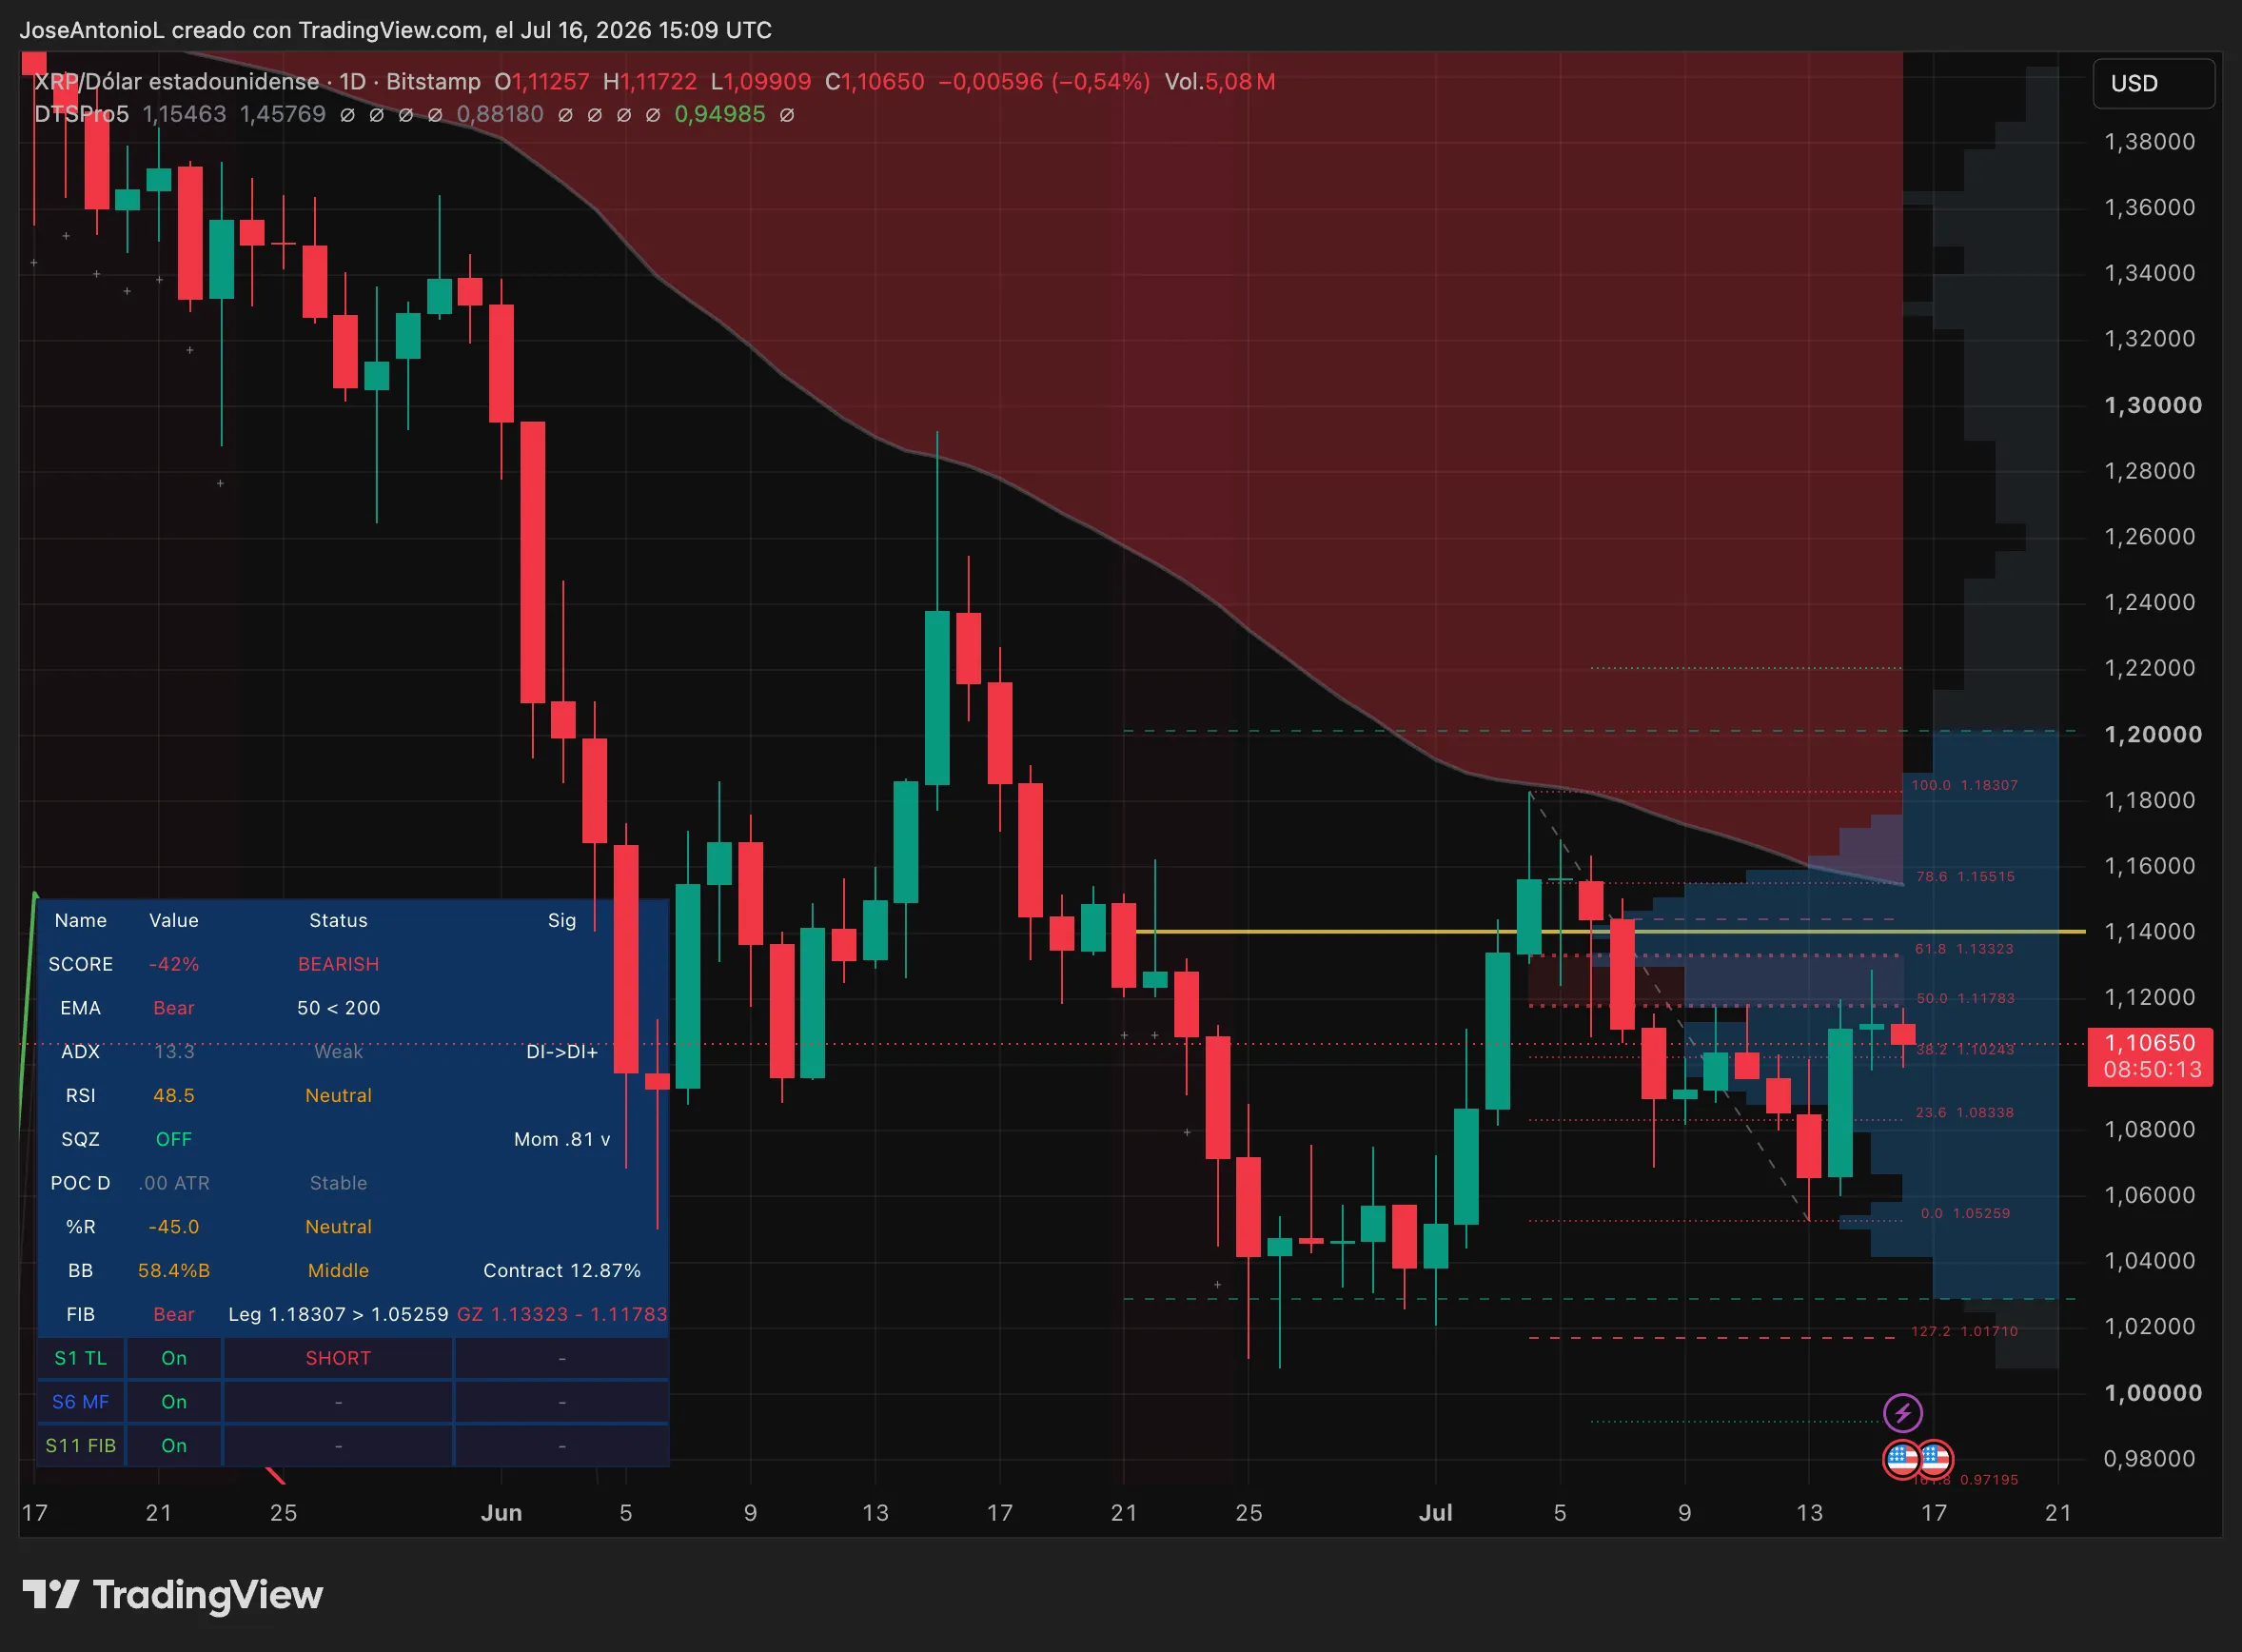
However, the optimistic market sentiment has not lifted all boats equally. XRP’s performance during this market-wide expansion was notably underwhelming. The token, closely associated with the co-founders of Ripple, opened Thursday’s trading session at $1.11257, reached an intraday high of $1.11722, and has since retraced to $1.10650—representing a minor decline of 0.54%. While XRP did not experience a sharp sell-off, it failed to capture the upward momentum seen across the rest of the market during the peak of the rally, and it continues to lag as the broader market consolidates.
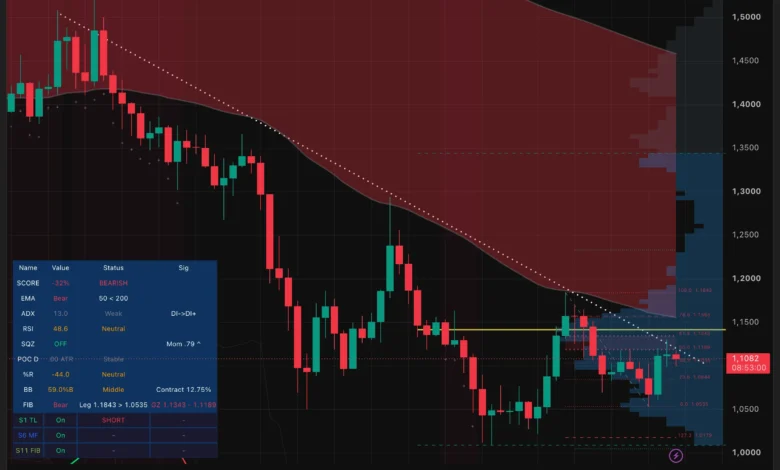
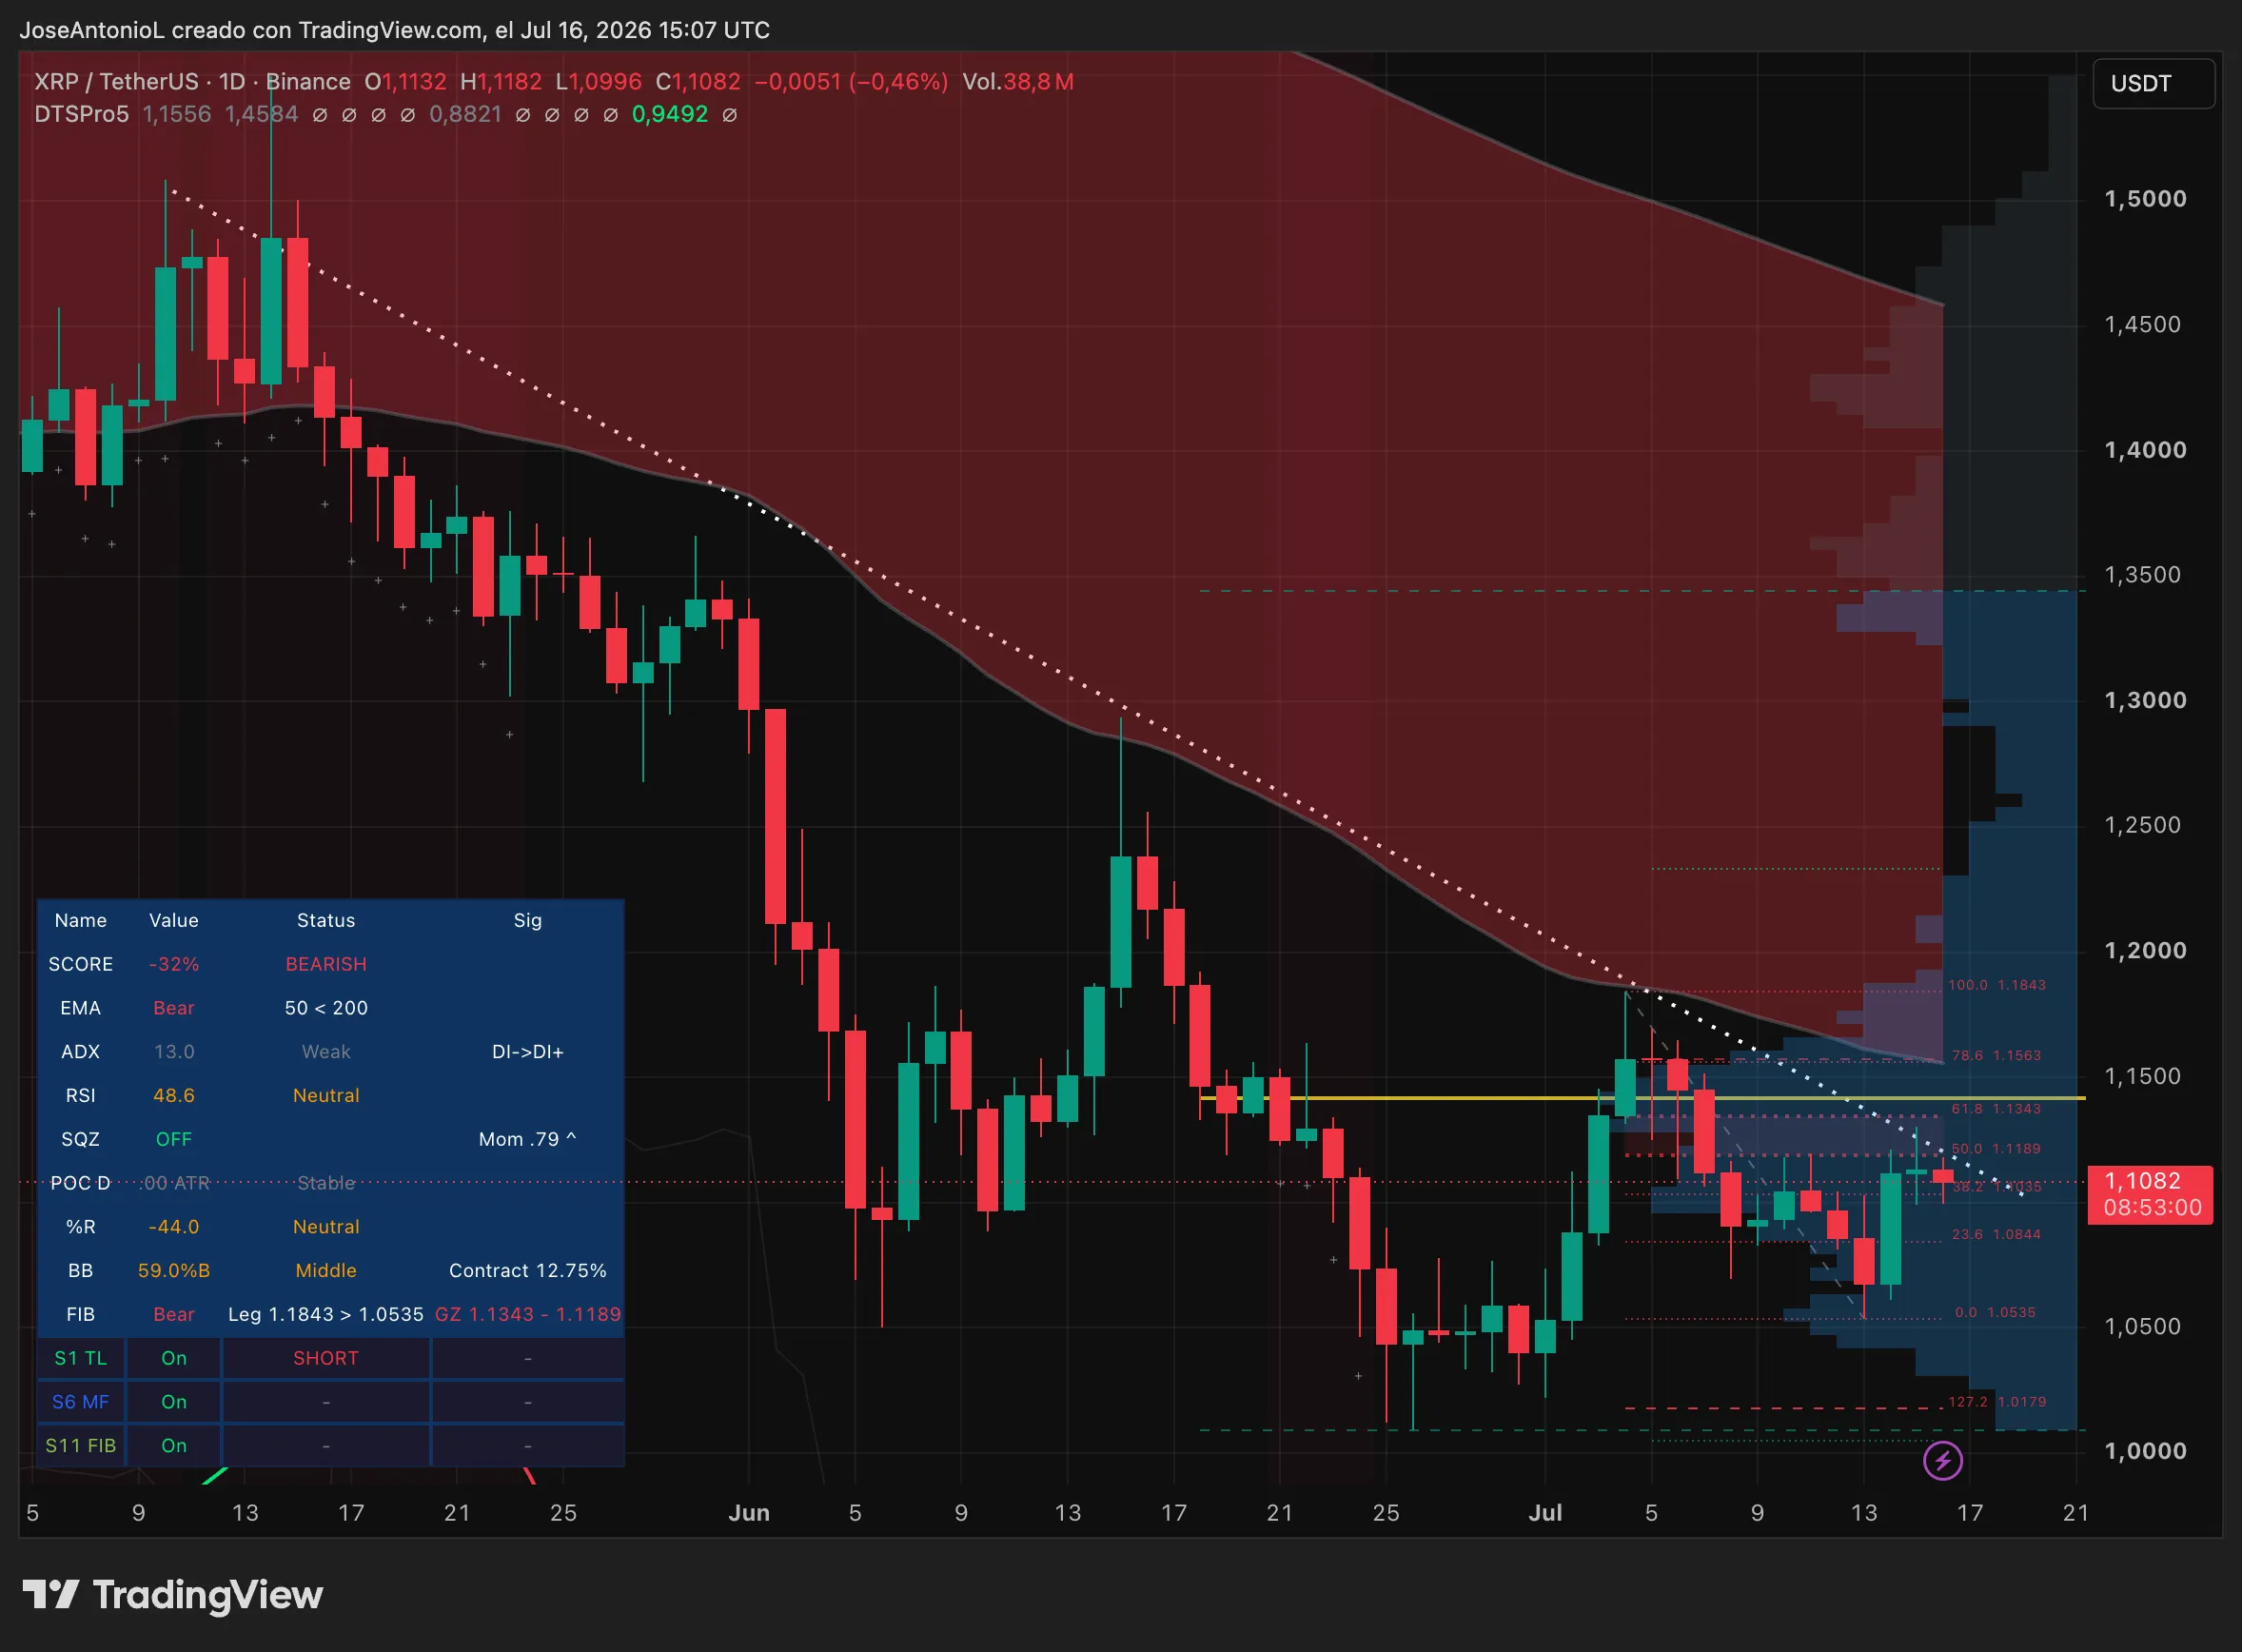
Technical charts indicate that XRP failed to break above the key price resistance level established during the previous Crypto Winter (represented by the dotted line on the chart below) when market conditions were highly favorable. Now that trading volumes and momentum are slowing down, the immediate outlook among market participants appears less optimistic compared to other major altcoins.
 XRP price data. Image: Tradingview
This divergence in performance highlights how capital behaves when re-entering the digital asset ecosystem after a risk-off period. Institutional and retail liquidity typically concentrates in the most liquid assets first. Bitcoin generally absorbs the initial wave of inflows, followed closely by Ethereum. Historically, ETH has served as a leading indicator for broader altcoin recoveries, a pattern that played out clearly this week.
In the short term, Ethereum’s market structure appears structurally more bullish than Bitcoin’s. Having suffered a deeper percentage drawdown during the prior market correction, Ethereum’s subsequent rebound has exhibited stronger relative momentum.
 XRP price data. Image: Tradingview
The broader lag in the altcoin market is further illustrated by the Altcoin Season Index, which currently sits at 45. A reading below 50 indicates that the market remains dominated by Bitcoin and Ethereum, with capital yet to rotate down the risk curve into smaller-cap assets. This trend was also visible in early July: when a major $602 million short liquidation event propelled Bitcoin back toward the $62K level, XRP managed a modest 3% gain, while Ethereum and Solana posted nearly double that performance.
Beyond general market dynamics, XRP is also grappling with asset-specific headwinds. The highly anticipated Senate floor vote on the Clarity Act—a crucial piece of U.S. legislation that could establish a clear regulatory classification for XRP as a commodity and potentially pave the way for institutional spot ETFs—missed its expected July 4 timeline. With the legislative calendar delayed, the vote now appears unlikely to occur until late July or August at the earliest. In the absence of this regulatory catalyst, XRP remains highly dependent on macro sentiment, a battle it is currently losing to Ethereum.
Technical Outlook: XRP Testing Key Support Levels
XRP opened today’s daily candlestick at $1.11 and is currently trading hands at $1.10, maintaining a market capitalization of approximately $69 billion. The asset is currently testing a weak support zone near the bottom of its most recent bearish leg, which saw the price decline from a high of $1.18 down to $1.05.
This positions the token at a critical technical juncture. If buyers can defend this level, XRP could attempt a push back toward the $1.13 resistance. Conversely, a failure to hold the $1.08 level could reopen a downward path toward $1.06, bringing the critical $1.02 support floor back into play.
 XRP price data. Image: Tradingview
Technical indicators reflect this lack of clear direction. The ADX—Average Directional Index—currently registers a reading of 13.3, which is well below the key threshold of 25 that typically confirms the presence of a strong trend. Because the ADX measures trend strength on a 0–100 scale regardless of direction, a reading below 20 indicates a choppy, range-bound market where false breakouts are common. On a slightly positive note, the directional movement index shows the DI- (bearish indicator) gradually shifting toward the DI+ (bullish indicator), though this shift remains weak given the low overall ADX value.
The Exponential Moving Averages (EMAs) provide a clearer view of the asset’s longer-term trend. XRP’s 50-day EMA continues to trade well below its 200-day EMA, maintaining a classic bearish pattern known as a death cross.
The death cross is a widely recognized indicator of long-term bearish momentum. XRP has remained locked in this configuration since its decline from its all-time high of $3.65, which was established in July 2025. While Bitcoin is currently battling to avoid its own death cross, XRP’s moving averages show no immediate signs of convergence.
Meanwhile, the RSI—Relative Strength Index, a momentum oscillator that measures overbought conditions above 70 and oversold conditions below 30—sits at a neutral 48.5, indicating an absence of immediate buying or selling pressure. The Squeeze Momentum indicator is currently “off” with a marginal momentum reading of 0.81v. This indicates that while market energy is slowly compressing, it has not yet gathered enough strength to dictate a clear directional breakout. Whether XRP breaks up or down from this consolidation pattern will likely depend on Bitcoin’s ability to maintain its $64K support level and any upcoming scheduling updates regarding the Clarity Act in the Senate.