
XRP Surge Reaches 30% as Macro Liquidity Spark Hits Institutional Resistance
Digital asset hits $1.29 after U.S. Treasury buyback plan sparks market rally, but ETF inflows drop.

A sharp multiday advance pushed XRP back toward $1.29 on Thursday, recovering 30% from its weekend close below $1.
The rally marks the digital coin’s strongest weekly performance in months, launching from price levels unseen since immediately preceding its late 2024 run. The token bottomed at $0.9862 last week, revisiting the exact support zone it occupied before November 2024’s post-election surge drove it toward an all-time high near $3.65.
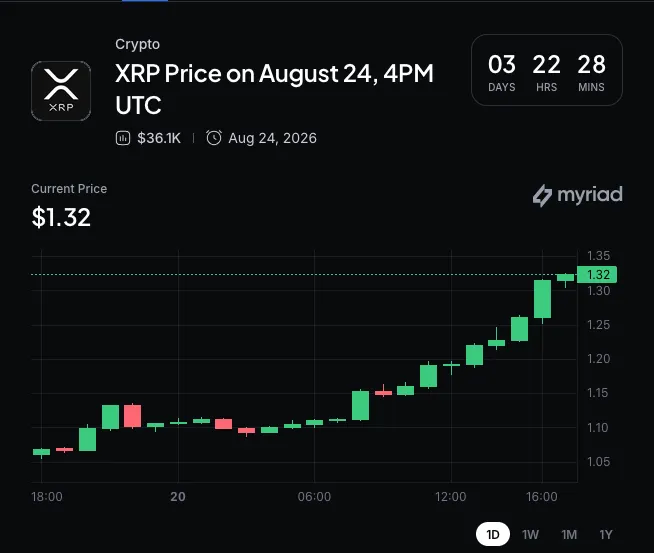 Myriad: XRP price next move? Click to make your prediction.
Wednesday provided the primary impetus as XRP gained 10.40% in a single day—its sharpest individual session move since February 6, when the asset jumped over 20%. Buying extended into Thursday, pushing the weekly candlestick toward $1.32 and bringing the token closer to its 200-day moving average than at any point since early this year.
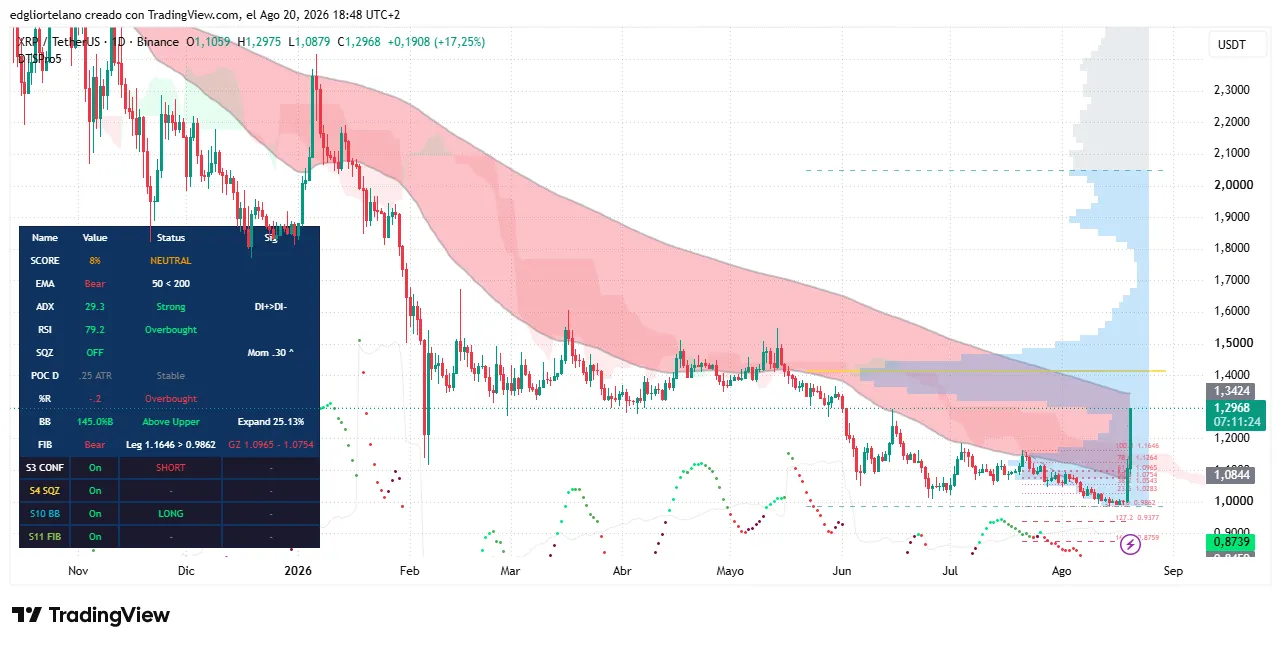 XRP price data. Image: Tradingview
The surge was ignited by Bitcoin, which broke above $72,000 on Thursday to reach its highest level since a June flash crash. That move followed an announcement from the U.S. Treasury that it plans to double long-bond buybacks to at least $4 billion per operation starting September 9. The policy statement triggered $3 billion in short liquidations within 24 hours, occurring just hours before Donald Trump met with executives from Coinbase, Ripple, and Robinhood at the White House.
Treasury buyback operations systematically inject liquidity into sovereign debt markets by acquiring longer-dated securities from primary dealers, a process that depresses long-term yields and typically forces capital reallocation into speculative assets.
While macro factors helped drive the market, XRP outstripped the gains predicted by its standard historical correlation with Bitcoin. On technical charts, the token’s daily Relative Strength Index, or RSI, surged to 79.2.
The RSI measures price velocity on a scale from 0 to 100, where low values indicate an oversold asset and elevated figures signal overbought conditions. Clustered near 80, XRP is deep in overbought territory. Meanwhile, its Average Directional Index, or ADX, holds above 29, signaling accelerating trend strength following the breakout, as readings above 25 denote a confirmed directional trend.
In contrast to the price gains, underlying fund flows revealed diverging investor behavior. Daily XRP ETF inflows shrank from $5.81 million to $2.35 million on the same day XRP outpaced Bitcoin, while spot Bitcoin ETFs recorded $517 million in net inflows—their largest single-day total since May.
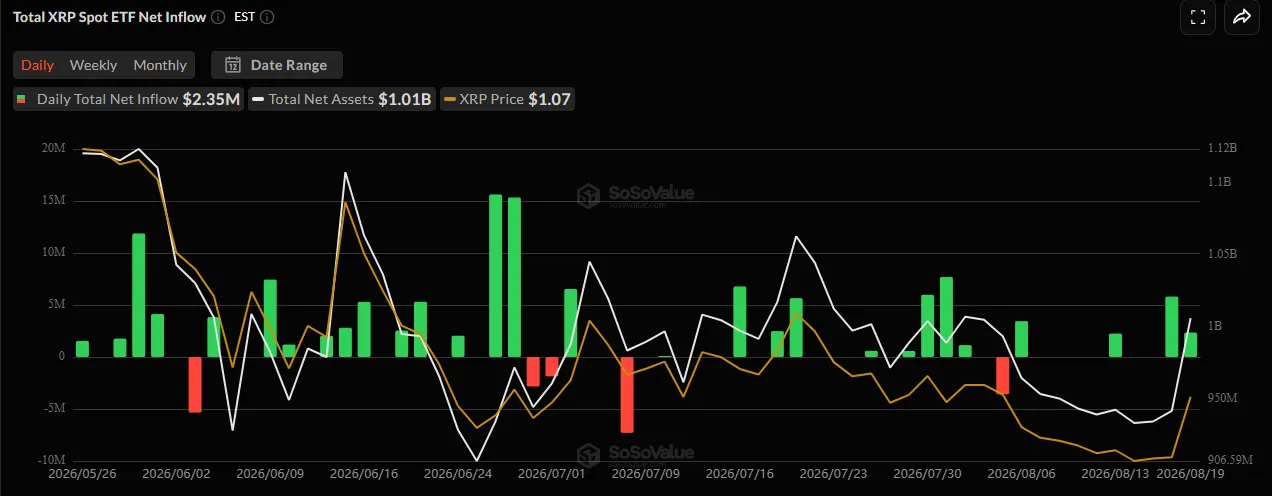 XRP ETF data. Image: CoinGlass
Leverage in derivatives markets also pulled back, with futures open interest dropping 11.31% from its peak during the surge, leaving XRP trading roughly 17.5% below its 200-day moving average.
Despite the sharp spot appreciation, the deceleration in institutional ETF creation to $2.35 million alongside an 11.31% reduction in futures open interest indicates that institutional traders remain cautious, leaving the token with substantial technical resistance to overcome before establishing a sustained structural reversal.