
Priced In: Why Coinbase and Circle Rallied Despite Slashed Earnings Forecasts
William Blair slashes estimates but remains bullish as technicals and on-chain data point to a cyclical trough.
In public equities, bad news does not always yield a sell-off. Sometimes, when expectations are sufficiently depressed, the confirmation of a challenging outlook simply signals that the worst has already been accounted for. This classic market dynamic played out on Wednesday as digital asset heavyweights Coinbase and Circle saw their stock prices climb despite a prominent Wall Street firm aggressively cutting its financial projections for the sector.
Shares of Coinbase (COIN) and Circle (CRCL) each rose roughly 3–4% on Wednesday. The catalyst was a fresh research note from William Blair, the Chicago-based investment bank founded in 1935 and widely recognized for its growth-equity coverage. While the firm slashed its revenue and earnings forecasts for Coinbase, it resolutely maintained its “outperform” rating, suggesting to clients that the prevailing market pain is already fully reflected in current valuations.
“We think investors should stay involved in Coinbase,” the firm noted, advising market participants to look past near-term headwinds in anticipation of a broader cyclical recovery.
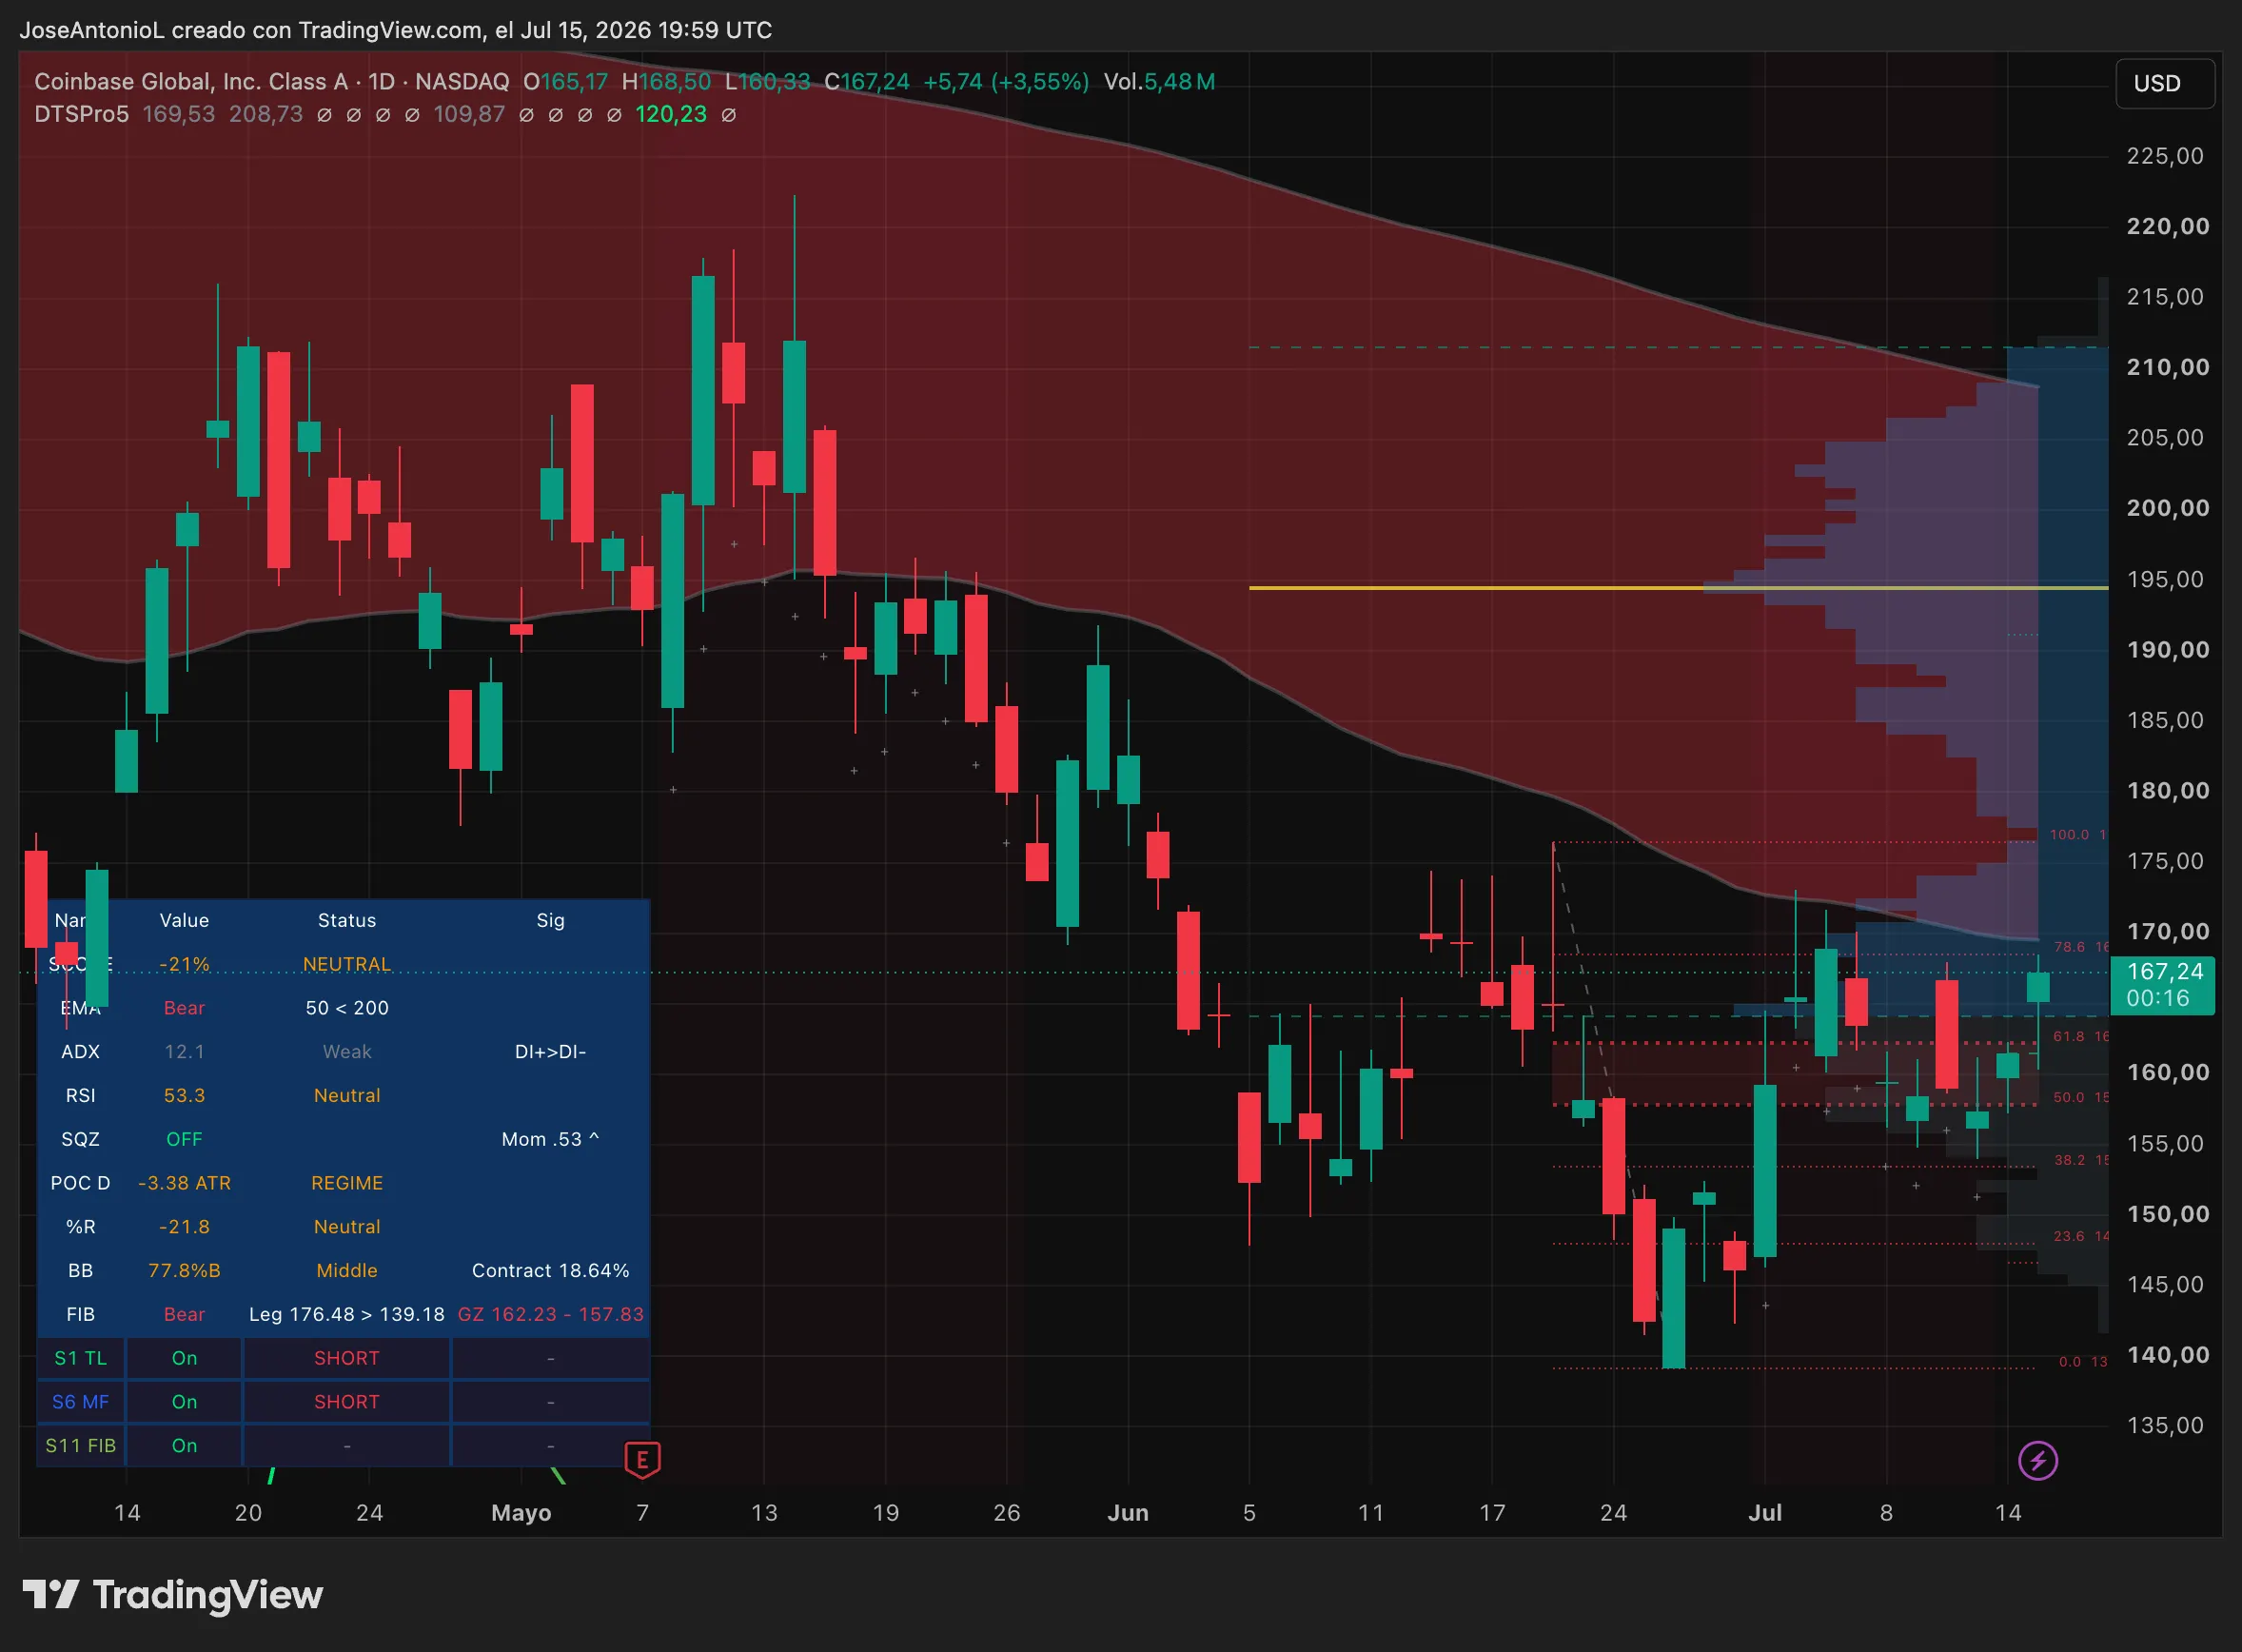
The revisions from William Blair analysts Andrew Jeffrey and Adib Choudhury were substantial. The firm cut its 2026 revenue estimates for Coinbase by 12% and its 2027 estimates by 13%. More drastically, it gutted its adjusted EBITDA projections by 34% for both years. According to the analysts, Coinbase’s earnings are set to trough in the second half of 2026 before staging a meaningful recovery in 2027. They argue that investors who stay the course will be rewarded as spot crypto volumes bottom alongside Bitcoin.
Specifically, William Blair expects Coinbase’s total trading volume to contract by roughly 44% this year, falling to $669 billion. However, the firm projects a sharp trend reversal in 2027, modeling a rebound of more than 32% in trading activity.
Crucially, the analysts emphasized that the digital asset market has undergone a structural transformation since the devastating crypto winter of 2022. The ecosystem is now underpinned by regulated spot Bitcoin ETFs, deeper institutional capital flows, and a significantly matured regulatory environment—stabilizing forces that simply did not exist during previous market downturns.
Furthermore, Coinbase is no longer entirely dependent on spot trading fees. William Blair highlighted the exchange’s Base layer-2 network as a potential major earnings driver moving forward. By processing transactions off the main Ethereum layer, Base generates high-margin sequencer fees for Coinbase. This, alongside retail derivatives and prediction markets, is helping diversify the company’s revenue base. Notably, Coinbase’s retail derivatives business alone crossed $200 million annualized in the first quarter.
Not all Wall Street analysts share this constructive medium-term outlook. Piper Sandler analyst Patrick Moley adopted a more cautious stance, cutting his price target on Coinbase to $155 from $170 while maintaining a “neutral” rating. Moley identified prediction markets and perpetual futures as the defining stories of the second quarter, noting that major global events like the World Cup drove massive engagement in prediction markets. However, he warned of “significant investor attention on the perpetual future threat” heading into the third quarter, suggesting that rising competition in the derivatives space could pressure Coinbase’s market share.
The equity adjustments come after a prolonged period of downward pressure. Coinbase has fallen nearly 30% this year, closely tracking a roughly 26% decline in Bitcoin. Meanwhile, stablecoin issuer Circle, which made its public debut in a highly anticipated June 2025 NYSE IPO at $31 per share, has dropped about 20% since January.
The Technical Angle: John Bollinger’s Fractal ‘W’
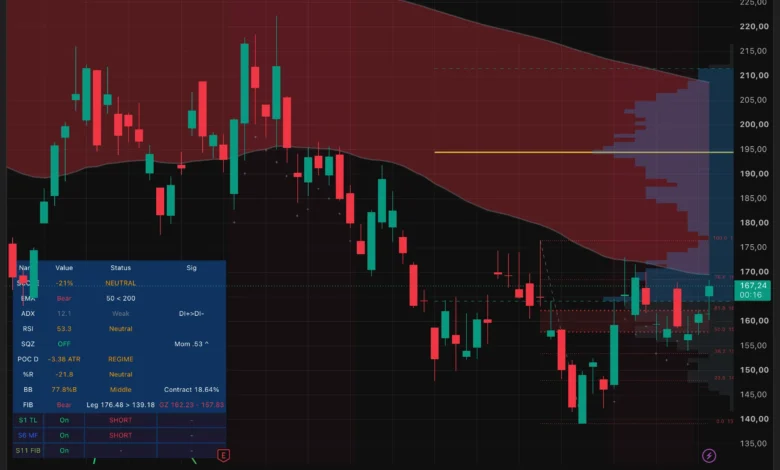
While fundamental analysts debate earnings multiples, technical analysts are observing signs of exhaustion in the downward trend. John Bollinger, the legendary technical analyst who created Bollinger Bands—a widely used volatility indicator that plots standard deviations above and below a simple moving average—has been tracking a highly constructive pattern on Bitcoin’s daily chart since early July.
On July 2, Bollinger shared his analysis on X, pointing to a developing “W” double-bottom pattern. In technical analysis, a double-bottom is a classic bullish reversal formation characterized by two consecutive local lows with a moderate rebound in between. The pattern is officially validated once the price breaks above the resistance level at the peak between the two troughs.
Bollinger described the current setup as “perfectly fractal,” meaning that smaller iterations of the same structure are nesting within larger ones, a phenomenon that is also visible on Bitcoin’s weekly chart. However, he maintained a note of caution, acknowledging that several previous bullish setups in this cycle had ultimately been invalidated by persistent selling pressure.
In a subsequent update, Bollinger stated that if this “W” double-bottom completes, he would view it as “a confirmation of a change in trend.” This represents his strongest public signal yet that the market’s downward momentum may be shifting. Bollinger also disclosed that he holds a long Bitcoin position through his investment vehicle, aligning his personal portfolio with his technical outlook.
On-Chain Data Points to a Potential Bottom
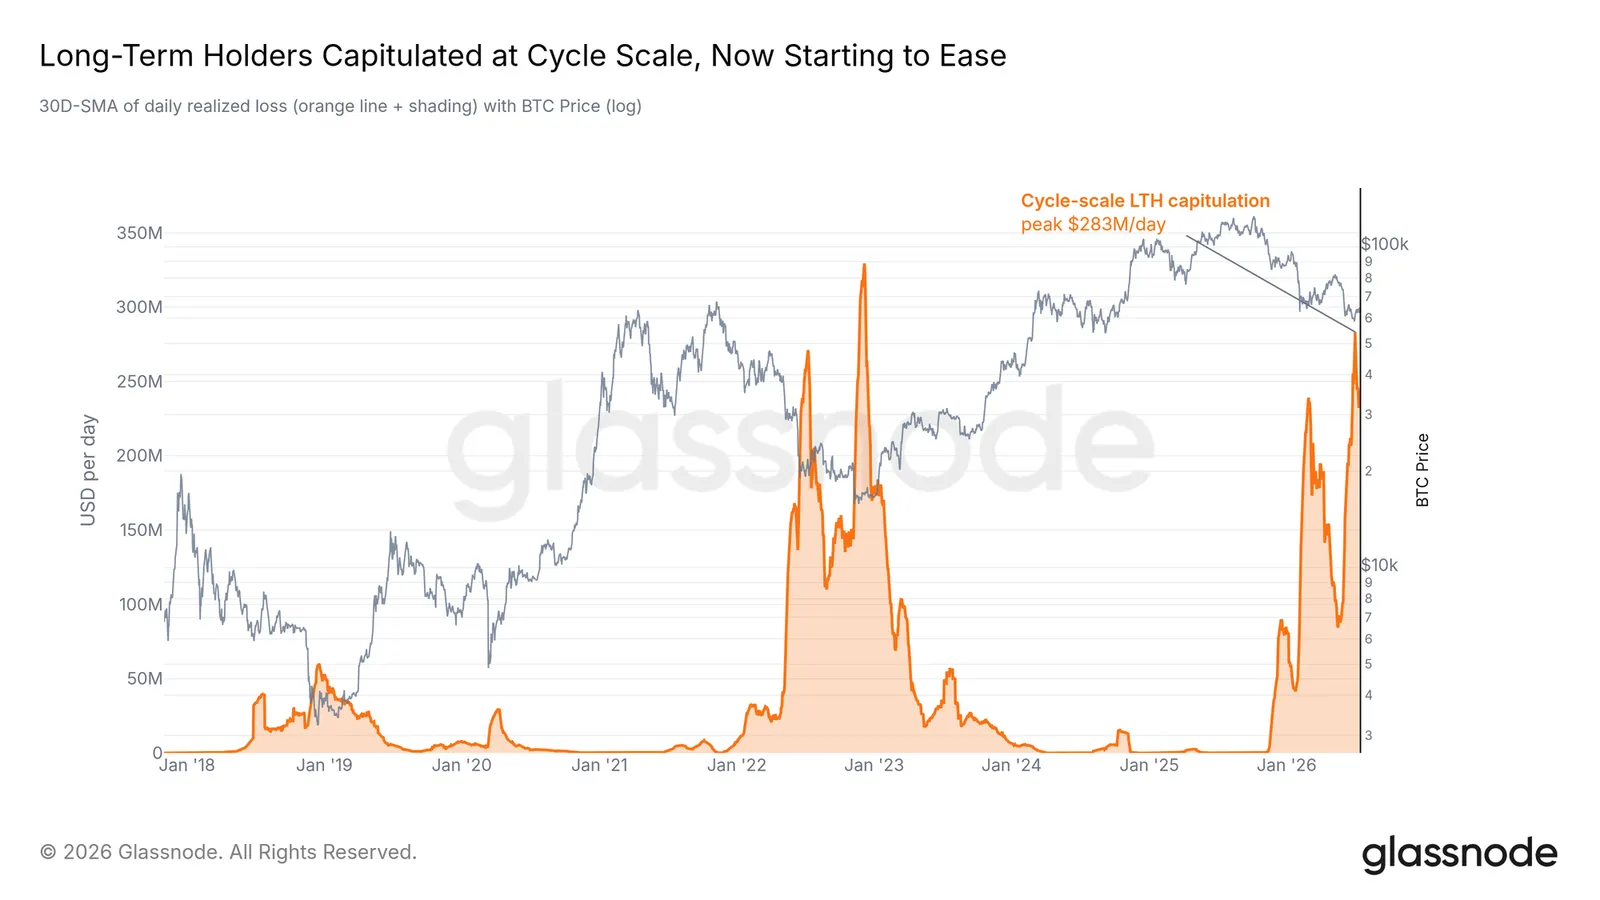
This technical optimism is supported by on-chain metrics. According to Glassnode’s latest weekly analysis, long-term holder capitulation—which has acted as a primary source of market-wide selling pressure throughout the year—reached its cyclical peak two weeks ago and has begun to trend downward.
This specific metric, which measures the actual losses realized by long-term holders while excluding internal wallet transfers, suggests that the cohort of high-conviction sellers is finally thinning out.
Furthermore, Glassnode documented robust accumulation across wallets of all sizes during the June price lows, indicating that buyers stepped in aggressively to absorb the sell-off. At the same time, Bitcoin’s inverse correlation with the U.S. dollar has strengthened, while its correlation with U.S. equities has decoupled. The asset’s sensitivity to macroeconomic data has also returned; Tuesday’s softer-than-expected inflation print triggered a sharper upward move in Bitcoin than in any major U.S. equity index.
Despite these encouraging signs, both Wall Street analysts and on-chain researchers agree that a full-scale recovery remains contingent on the return of sustained, spot-driven buying volume. While derivative positions are unwinding, long-term selling pressure is easing, and the fear premium in the options market is declining, the necessary capital inflows have not yet fully materialized. William Blair projects this inflection point will arrive in 2027, driven by a anticipated 32% rebound in Coinbase trading volume following this year’s projected 44% decline.