
Bitcoin’s Golden Cross Nears As Institutional Inflows Hit Record
Bitcoin faces macroeconomic headwinds but ETF inflows and technical signals suggest underlying resilience.
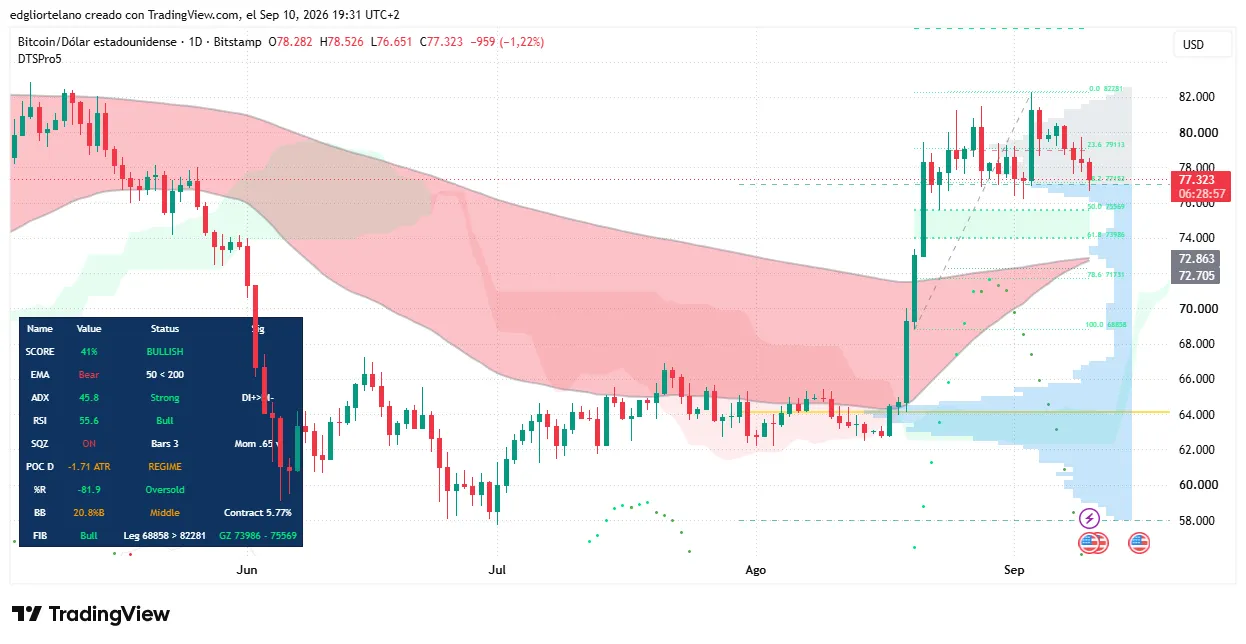
Bitcoin’s 50-day Exponential Moving Average (EMA) is rapidly closing the gap with its 200-day EMA. The intersection—referred to by technical analysts as a “golden cross” when the short-term average crosses above the long-term trendline—is projected to confirm around September 11. If realized, this would mark the first golden cross since November 2025, when a bearish “death cross” (the 50-day crossing below the 200-day) signaled the beginning of a prolonged cyclical correction.
On Thursday, Bitcoin fell 1.22%, shedding $959 to trade at $77,323. The digital asset opened the session at $78,282 and reached an intraday high of $78,526 before selling pressure dragged it to an intraday low of $76,651. This pullback follows last week’s rally above the $80,000 threshold, though the current price remains significantly higher than the August lows of approximately $64,000.


The sustained institutional appetite, facilitated by the SEC’s approval of spot ETFs in January 2024, has introduced a persistent bid from traditional brokerages and wealth managers that was largely absent in prior downturns. U.S. spot Bitcoin exchange-traded funds (ETFs) have experienced robust demand, drawing in $3.8 billion in net inflows over the past three weeks. This represents the strongest sustained stretch of inflows for the investment vehicles in 2026, pushing total net assets under management to a record $101.3 billion.
The downturn was part of a wider retreat for risk assets. Wall Street felt the pressure as the tech-heavy Nasdaq Composite dropped nearly 1% and the S&P 500 declined 0.59%. The sell-off was catalyzed by August’s Producer Price Index (PPI) report, which measured wholesale inflation pressures as hotter than economists had anticipated. The unexpected strength in producer prices has revived worries that the Federal Reserve may hold interest rates higher for longer—or potentially even consider rate hikes—rather than embarking on a highly anticipated cycle of rate cuts.
Supporting this potential trend reversal are several key chart metrics. The Average Directional Index (ADX), which quantifies the strength of a price trend regardless of direction, is currently reading 45.8. In classical chart analysis, any value above the 25 threshold indicates a strong, established trend, suggesting that Bitcoin’s multi-week upward momentum has solid backing. Meanwhile, the Relative Strength Index (RSI) sits at 55.6, indicating that the asset remains in bullish territory without entering the overbought zone (typically defined as above 70), leaving theoretical room for further price appreciation.
Despite these immediate headwinds, the structural support for Bitcoin appears fundamentally different from previous market cycles. Adding to the inflation concerns, global oil prices pushed past $100 a barrel, driven by ongoing geopolitical tensions between the United States and Iran. Rising energy costs historically feed directly into consumer price indices, complicating the central bank’s efforts to bring inflation down to its 2% target. In response to the data, U.S. Treasury yields spiked to multi-year highs, drawing capital away from speculative assets and putting pressure on both equities and the broader cryptocurrency market, where approximately 85% of the top 100 digital assets by market capitalization posted losses over a 24-hour period.
Additionally, the Squeeze Momentum Indicator is currently “on.” This metric is used by traders to identify periods of extreme volatility compression, which typically serve as a precursor to explosive price moves. If Bitcoin can maintain its current technical posture despite the macroeconomic pressure, analysts suggest the compression could break to the upside, solidifying the golden cross.
Nonetheless, technical indicators are inherently lagging, representing past price data rather than guaranteed future performance. False golden crosses have occurred historically, reversing quickly when external macroeconomic shocks disrupt market liquidity. With the Consumer Price Index (CPI) report scheduled for release on Friday and the Federal Reserve’s Federal Open Market Committee (FOMC) meeting looming on September 15, near-term price action is expected to remain highly sensitive to incoming macroeconomic data.