
Bitcoin Cycle Bottom Test: 4chan Date Meets Weak Jobs Data
Weak U.S. payroll data fuels rate-pause hopes as traders weigh a viral 364-day cycle theory against quantitative warnings of a deeper Q4 drop.
A weak U.S. employment report and a viral numerological prediction have converged on October 6, 2026, placing Bitcoin at the center of competing narratives about whether its yearlong correction has finally run its course.
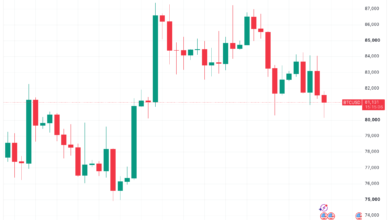
Bitcoin traded near $86,100 in early Tuesday sessions, up roughly 2% following the Labor Department’s release of September payroll data showing just 29,000 jobs added against consensus expectations of 90,000. The sharp miss immediately recalibrated interest rate expectations across derivatives markets, reinforcing bets that the Federal Reserve will hold borrowing costs steady rather than risk further tightening amid signs of labor market deterioration.
For risk assets like cryptocurrency, the prospect of a paused or dovish Fed provides critical support. Bitcoin’s correlation with traditional liquidity indicators remains elevated, meaning monetary policy decisions continue to exert outsized influence on digital asset pricing compared to previous cycles where adoption metrics drove independent rallies.


The macroeconomic backdrop collided with an unusual piece of internet lore gaining traction among retail traders. On December 12, 2023, an anonymous user on the imageboard 4chan posted a chart mapping Bitcoin’s historical cycle lengths. The post calculated that previous expansions from bear-market lows to bull-market peaks lasted exactly 1,064 days, while subsequent contractions from peak to trough spanned precisely 364 days. Applying those intervals forward, the user predicted a market top on October 6, 2025.
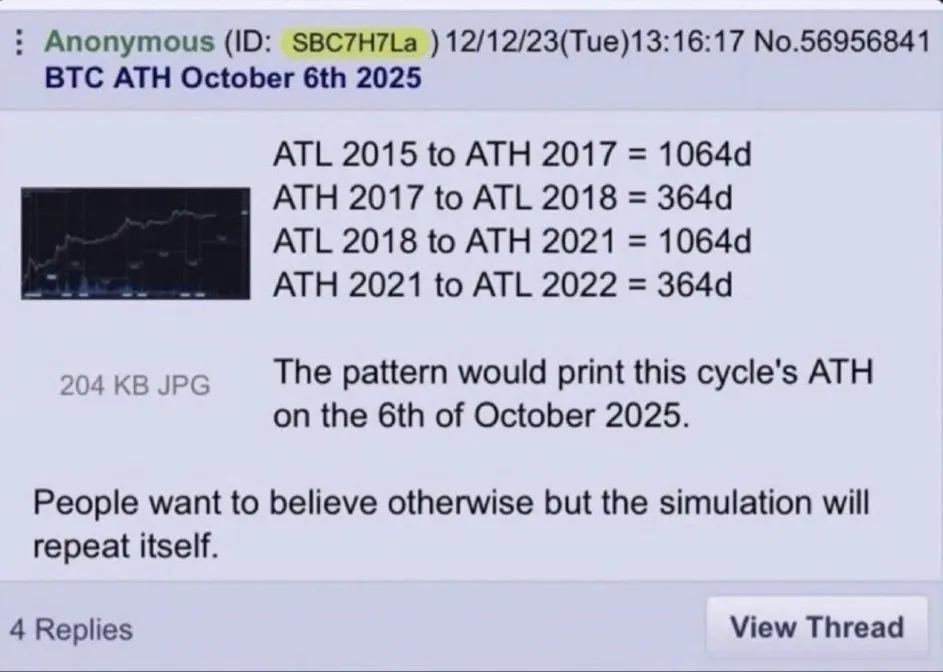
Bitcoin reached an all-time high of $126,198.07 on that exact date. While professional analysts dismissed the forecast as coincidence-driven numerology rather than structural market analysis, the precise alignment cemented the post as one of the most widely circulated predictions in recent crypto history.
Applying the second half of the same 364-day contraction interval places the theoretical cycle bottom on October 5, 2026 — yesterday. Yet current price action complicates the narrative. At roughly $86,000, Bitcoin sits approximately 32% below its record high. That drawdown is severe by traditional asset standards but historically shallow for cryptocurrency. During the 2018 and 2022 bear markets, Bitcoin suffered declines exceeding 80% from peak to trough. Crypto asset manager 21Shares noted earlier this year that even at its worst point during the current downturn, the retracement remained significantly milder than prior collapses, suggesting institutional capital inflows through spot exchange-traded funds approved in early 2024 may be structurally raising the asset’s floor.
That floor was tested severely in July when Bitcoin fell to approximately $57,000. Because the asset has since rebounded more than 50% from that mid-year low, technical analysts debate whether the actual cycle bottom already occurred months ago or if the July trough was merely a localized capitulation event within a broader, unfinished downtrend.
Benjamin Cowen, a quantitative analyst tracking long-term accumulation phases, identified July 1 as the start of a new accumulation window but cautioned that historical models leave room for a fourth-quarter flush. Cowen’s framework suggests a potential retest toward $44,000 before a sustainable reversal takes hold, a level that would align with deeper Fibonacci retracement zones drawn from the 2024 breakout levels.
Unlike previous cycles driven almost entirely by retail speculation and leverage, the current market operates under different mechanics. Spot Bitcoin ETFs now absorb billions in daily volume, altering how quickly capital enters and exits the ecosystem. This structural shift makes direct day-count comparisons to 2017 or 2021 cycles inherently flawed, regardless of their mathematical elegance.
Federal funds futures currently reflect diminished odds of any rate increase before the end of the year, with traders heavily pricing in sustained accommodation heading into 2027. Bitcoin’s intraday range tightened between $85,010 and $86,949 over the past 24 hours, with spot volumes registering approximately $1.5 billion as markets digest both the payroll shock and the calendar anomaly.