
Why Workers’ Share of U.S. Income Hit a Record Low in 2026
Accounting changes explain part of the decline, but automation, corporate power, and weaker worker leverage drove the rest
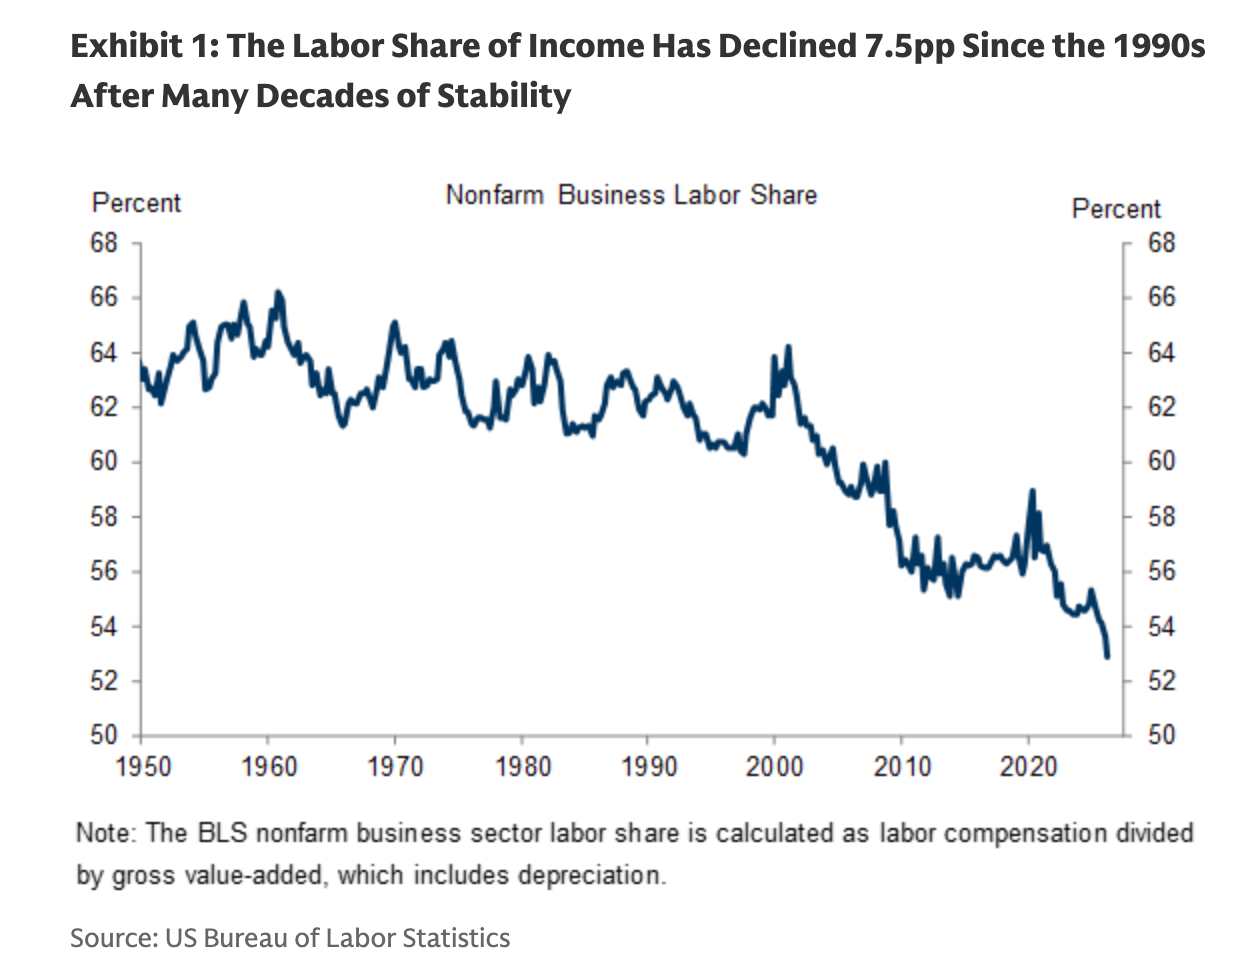
WASHINGTON — The labor share of nonfarm business output fell to 52.8%–52.9% in the second quarter of 2026, according to the Bureau of Labor Statistics (BLS). It was the lowest reading recorded since the federal government began tracking the metric in 1947, down roughly 7.5 percentage points from the 1990s, when workers routinely captured more than 60% of gross output.
Goldman Sachs economist Abhay Duggirala reached a different conclusion about the size of the underlying shift. In the report *“What Explains the Decline in the Labor Share of Income?”*, he found that approximately 40% of the 7.5-percentage-point decline—about 3.0 percentage points—came from measurement distortions in federal accounting standards. The remaining 60%, or roughly 4.5 percentage points, reflected structural changes in the economy.
Those changes include corporate consolidation, workplace automation, and reduced labor bargaining leverage. The Federal Reserve reports that the top 10% of U.S. households hold the vast majority of corporate equities and mutual fund shares, directing excess corporate profits generated by market markups primarily to wealthy investors rather than the broader labor force.


One distortion followed the Tax Reform Act of 1986, which lowered individual tax rates relative to corporate rates. Millions of business owners responded by moving from traditional C-corporations to pass-through structures, including S-corporations, limited liability companies (LLCs), and partnerships. Income that had previously been categorized as W-2 wages was consequently relabeled as business profit or owner distributions.
Research led by economist Matthew Smith, along with studies by economists Eric Zwick and Owen Zidar, documented the effects of that structural migration. Zwick and Zidar’s research into top-tier earners found that pass-through business owners account for the majority of income growth among the top 1% of earners. The 20% pass-through deduction enacted under the 2017 Tax Cuts and Jobs Act preserved incentives for high earners to receive income as pass-through profits rather than salaried wages, while lower-income workers increasingly moved into independent contract or gig arrangements.
The BLS also calculates labor share by dividing total worker compensation by gross value-added output. That denominator includes physical and technological depreciation. Corporate investment has shifted from long-lived physical infrastructure, such as industrial facilities, toward rapidly depreciating assets, including computer hardware, software, and information technology systems.
As overall capital depreciation rates increased, the mathematical denominator in the BLS formula expanded. The reported labor share therefore declined even though net income captured by capital owners remained unchanged by depreciation costs. A separate issue involves equity compensation: official BLS wage tracking records stock options and other equity-based pay when the instruments vest or are exercised, rather than when they are granted.
Executive and professional compensation moved increasingly toward equity grants over the past three decades. Standard government wage measures consequently omitted substantial portions of total worker pay during grant periods, particularly for high-earning corporate employees because equity compensation is concentrated among upper-income workers.
Goldman Sachs attributed the genuine 4.5-percentage-point reallocation of gross business output since the 1990s to several macroeconomic forces. Market power became concentrated in dominant companies across technology, retail, and services, while high-markup “superstar” firms generated elevated profit margins relative to their total labor costs.
Automation and artificial intelligence have also reduced the labor required per unit of output. Industry surveys show that current AI tools are used by roughly 9% of workers earning under $30,000 annually, compared with 34% of earners making more than $100,000. High earners increasingly use technology defensively to preserve productivity, while companies use automation investments to replace routine labor tasks and capture productivity gains as corporate capital returns.
Goldman Sachs noted that continued automation through AI is poised to exert further downward pressure on the labor share in coming years. At the same time, union density fell from over 20% of the U.S. workforce in the early 1980s to approximately 10% in recent years. That decline, combined with increased employer market concentration, limited workers’ ability to negotiate wage increases in line with overall productivity growth.
The distribution of income has shifted unevenly across household groups. A Congressional Budget Office (CBO) report on long-term income dynamics found that the top 1% of households doubled their share of total pre-tax and pre-transfer national income between 1979 and 2022. During the same period, the middle three income quintiles’ share of post-tax and post-transfer income declined by 6 percentage points, primarily because capital gains became concentrated among top-tier wealth holders.
An analysis published by the American Enterprise Institute (AEI), authored by economists Stephen Rose and Scott Winship, found that the share of U.S. families classified as upper-middle class rose from 10% to 31% between 1979 and 2024. Real median family income grew by 52% over that period. The study also found that the combined share of total family income held by the upper-middle class and the top 1% increased from 28% in 1979 to 68% by 2024.
Winship characterized the outcome as a system of “broad prosperity, unequally shared.” Nick Maggiulli, chief operating officer at Ritholtz Wealth Management, described an “upper-middle-class trap” affecting earners making between $200,000 and $400,000 annually.
Households in that income bracket often face escalating costs for scarce positional goods, including housing in high-performing school districts and premier higher education. Those expenses can force higher-earning workers to maintain longer work hours to retain their relative socioeconomic status.
As corporate equity values reflect higher capital returns, households whose income derives entirely from payroll wages remain subject to the structural labor share decline, while capital-holding households absorb the financial returns generated by corporate efficiency gains and technological automation.