
Bitcoin Finds Support at 200-Day Average as ‘Death Cross’ Clouds Recovery Hopes
Market remains cautious as technical indicators clash with regulatory hopes.
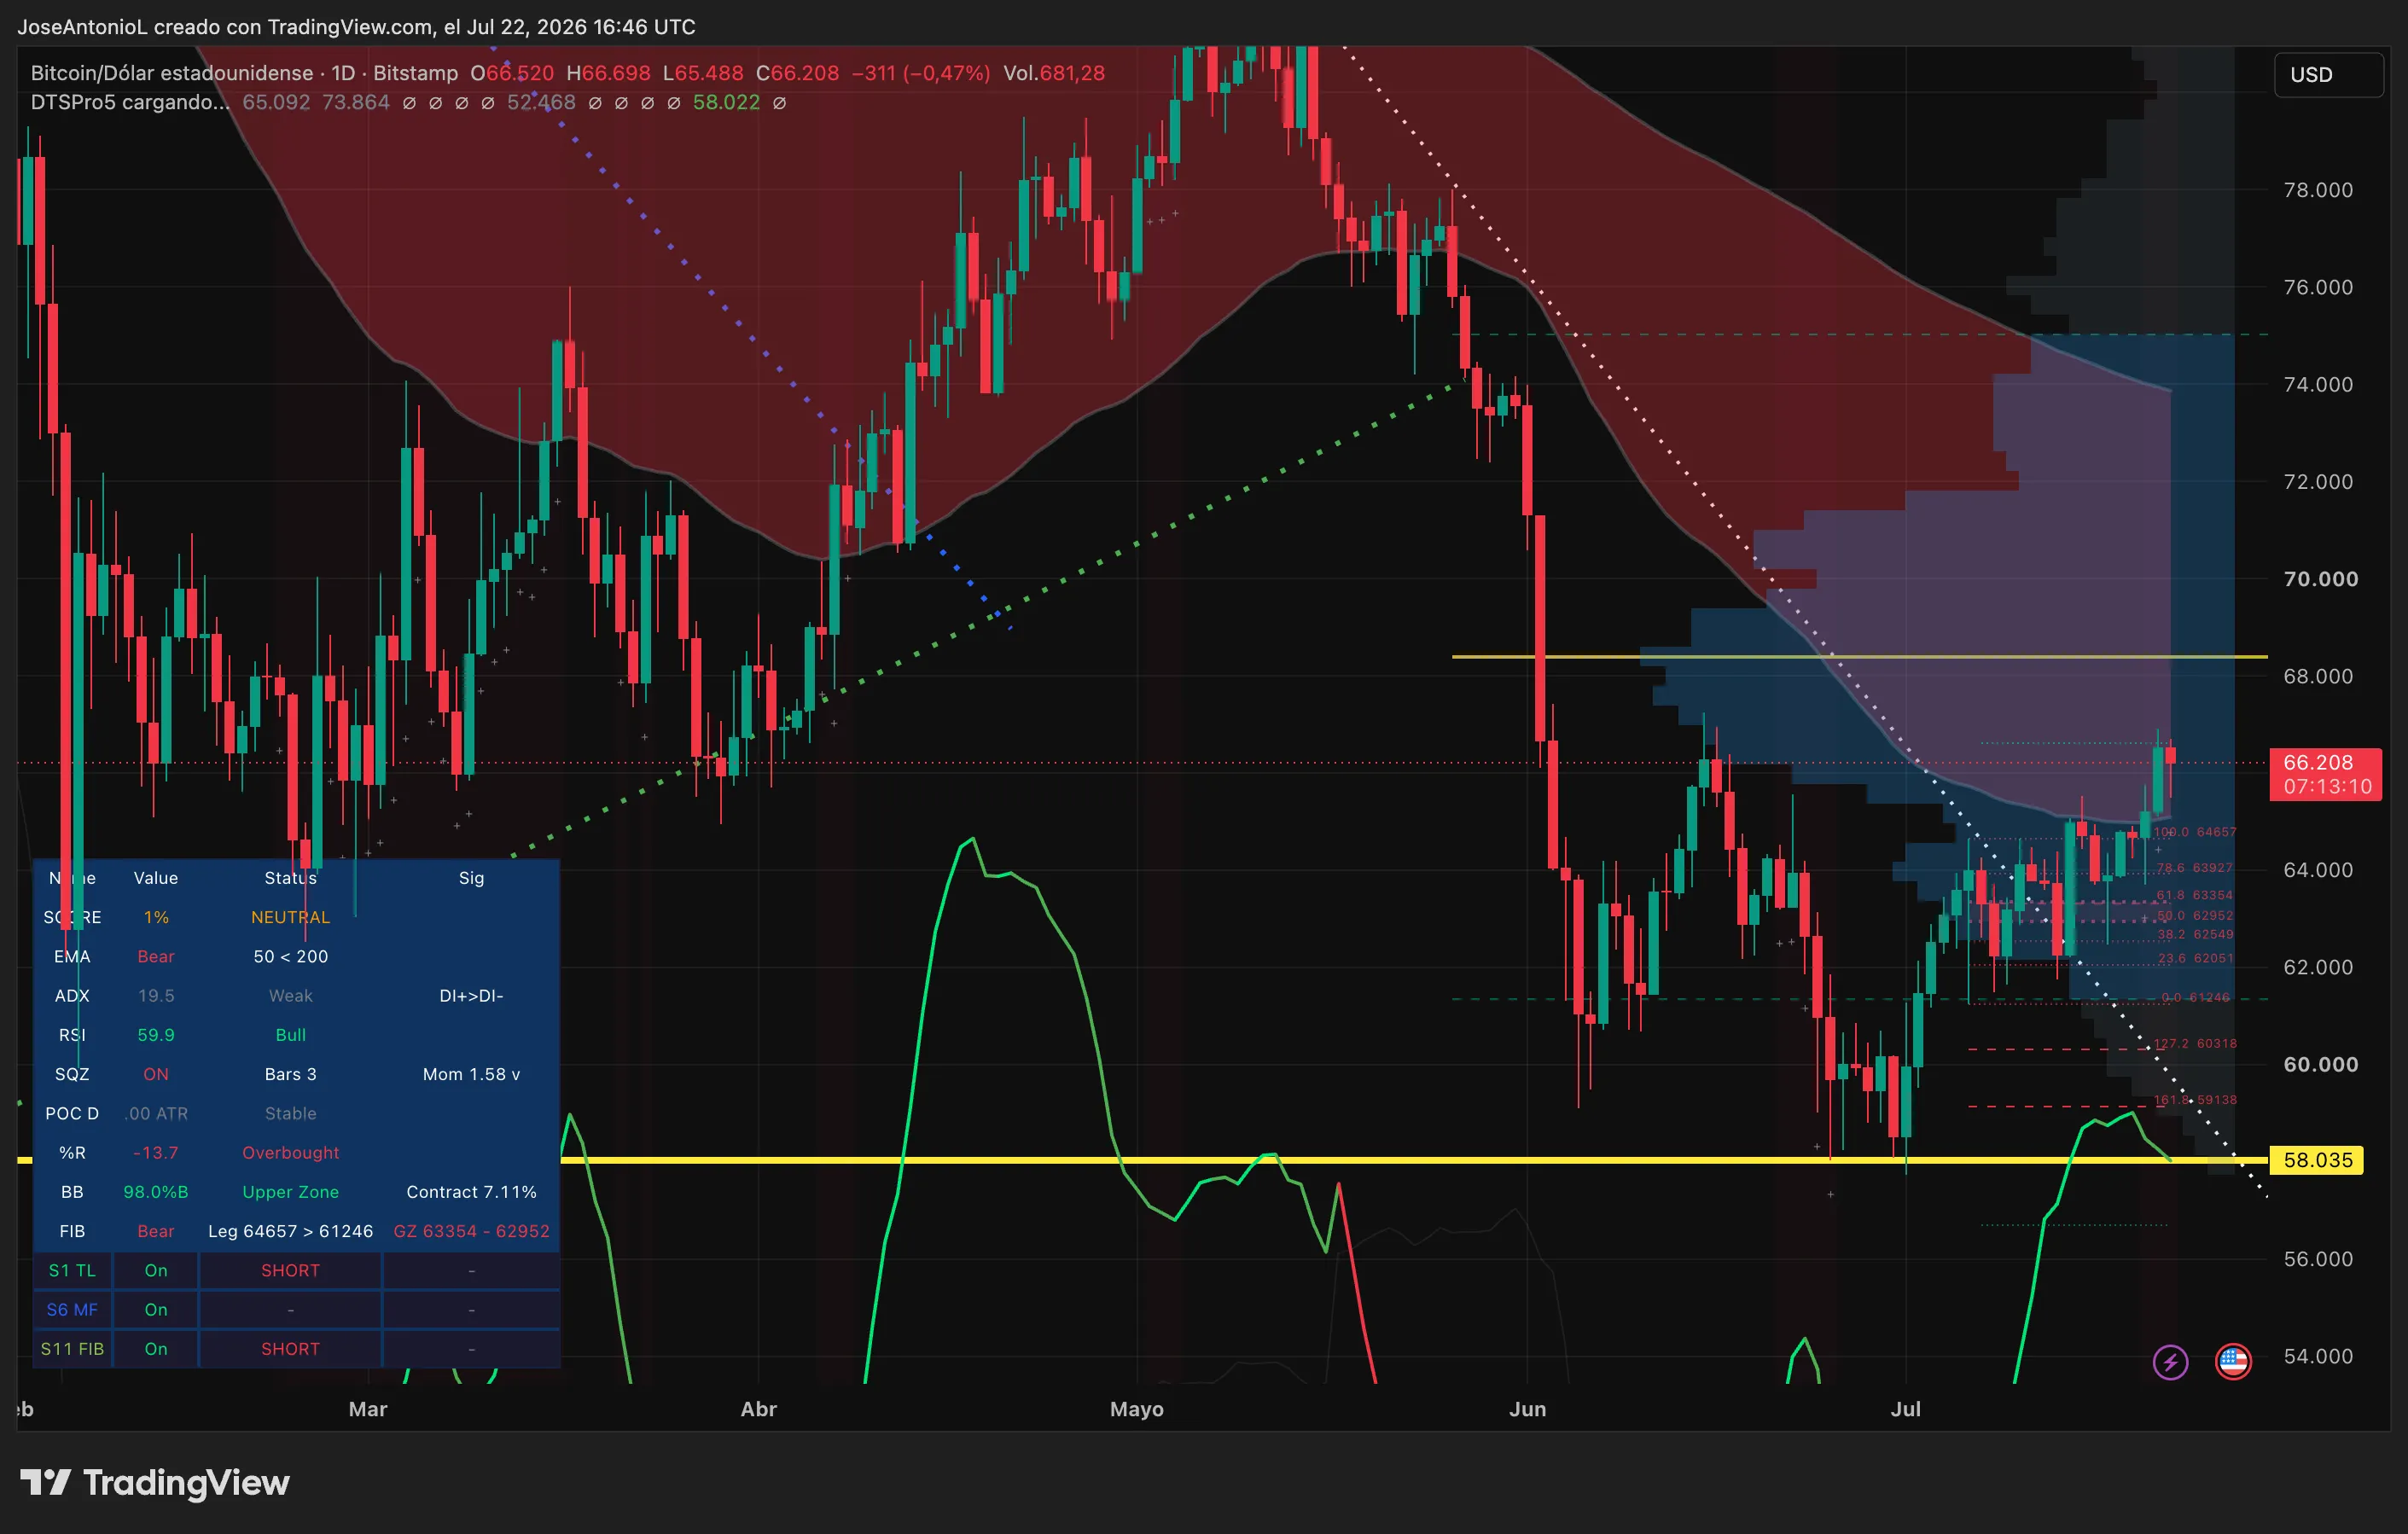
Bitcoin’s recent recovery to the $66,000 level has provided a temporary reprieve for investors, but technical indicators suggest the digital asset remains in a precarious position. While the 200-day exponential moving average (EMA) successfully acted as a price floor during a recent tumble toward the $53,000–$54,000 range, a lingering “death cross” continues to cast a shadow over the market’s short-term prospects.
As of Wednesday, Bitcoin was trading near $66,208, marking a significant bounce from its recent lows. The 200-day EMA is a critical technical metric used by traders to identify long-term trends; by weighing recent price data more heavily than older data, it offers a smoothed view of market direction. When an asset finds support at this level, it typically indicates that long-term buyers are stepping in to prevent further decline. However, the 50-day EMA remains positioned below the 200-day EMA—a formation known as a death cross—which historically signals that short-term momentum is lagging behind long-term averages.
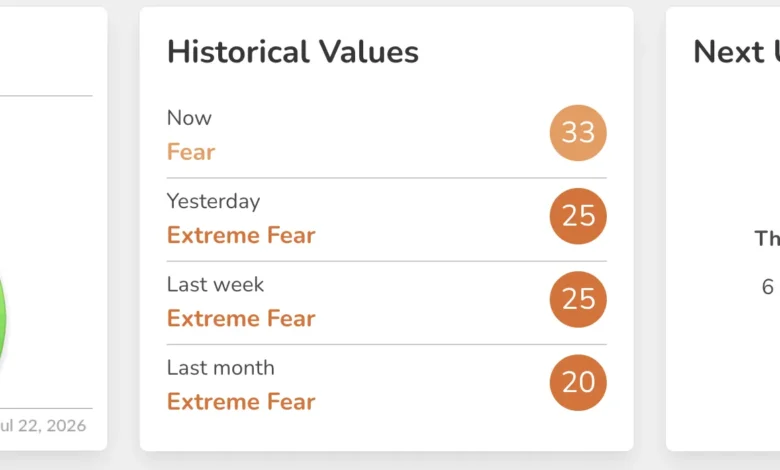
The broader financial landscape is adding to the uncertainty. U.S. equity markets showed signs of hesitation on Wednesday as investors awaited quarterly earnings reports from tech giants Alphabet and Tesla. The S&P 500 and Nasdaq both saw early dips, reflecting a cautious stance on Wall Street regarding high-growth sectors. This sentiment is mirrored in the Crypto Fear & Greed Index, which currently sits at 33, indicating a state of “fear” rather than outright panic.
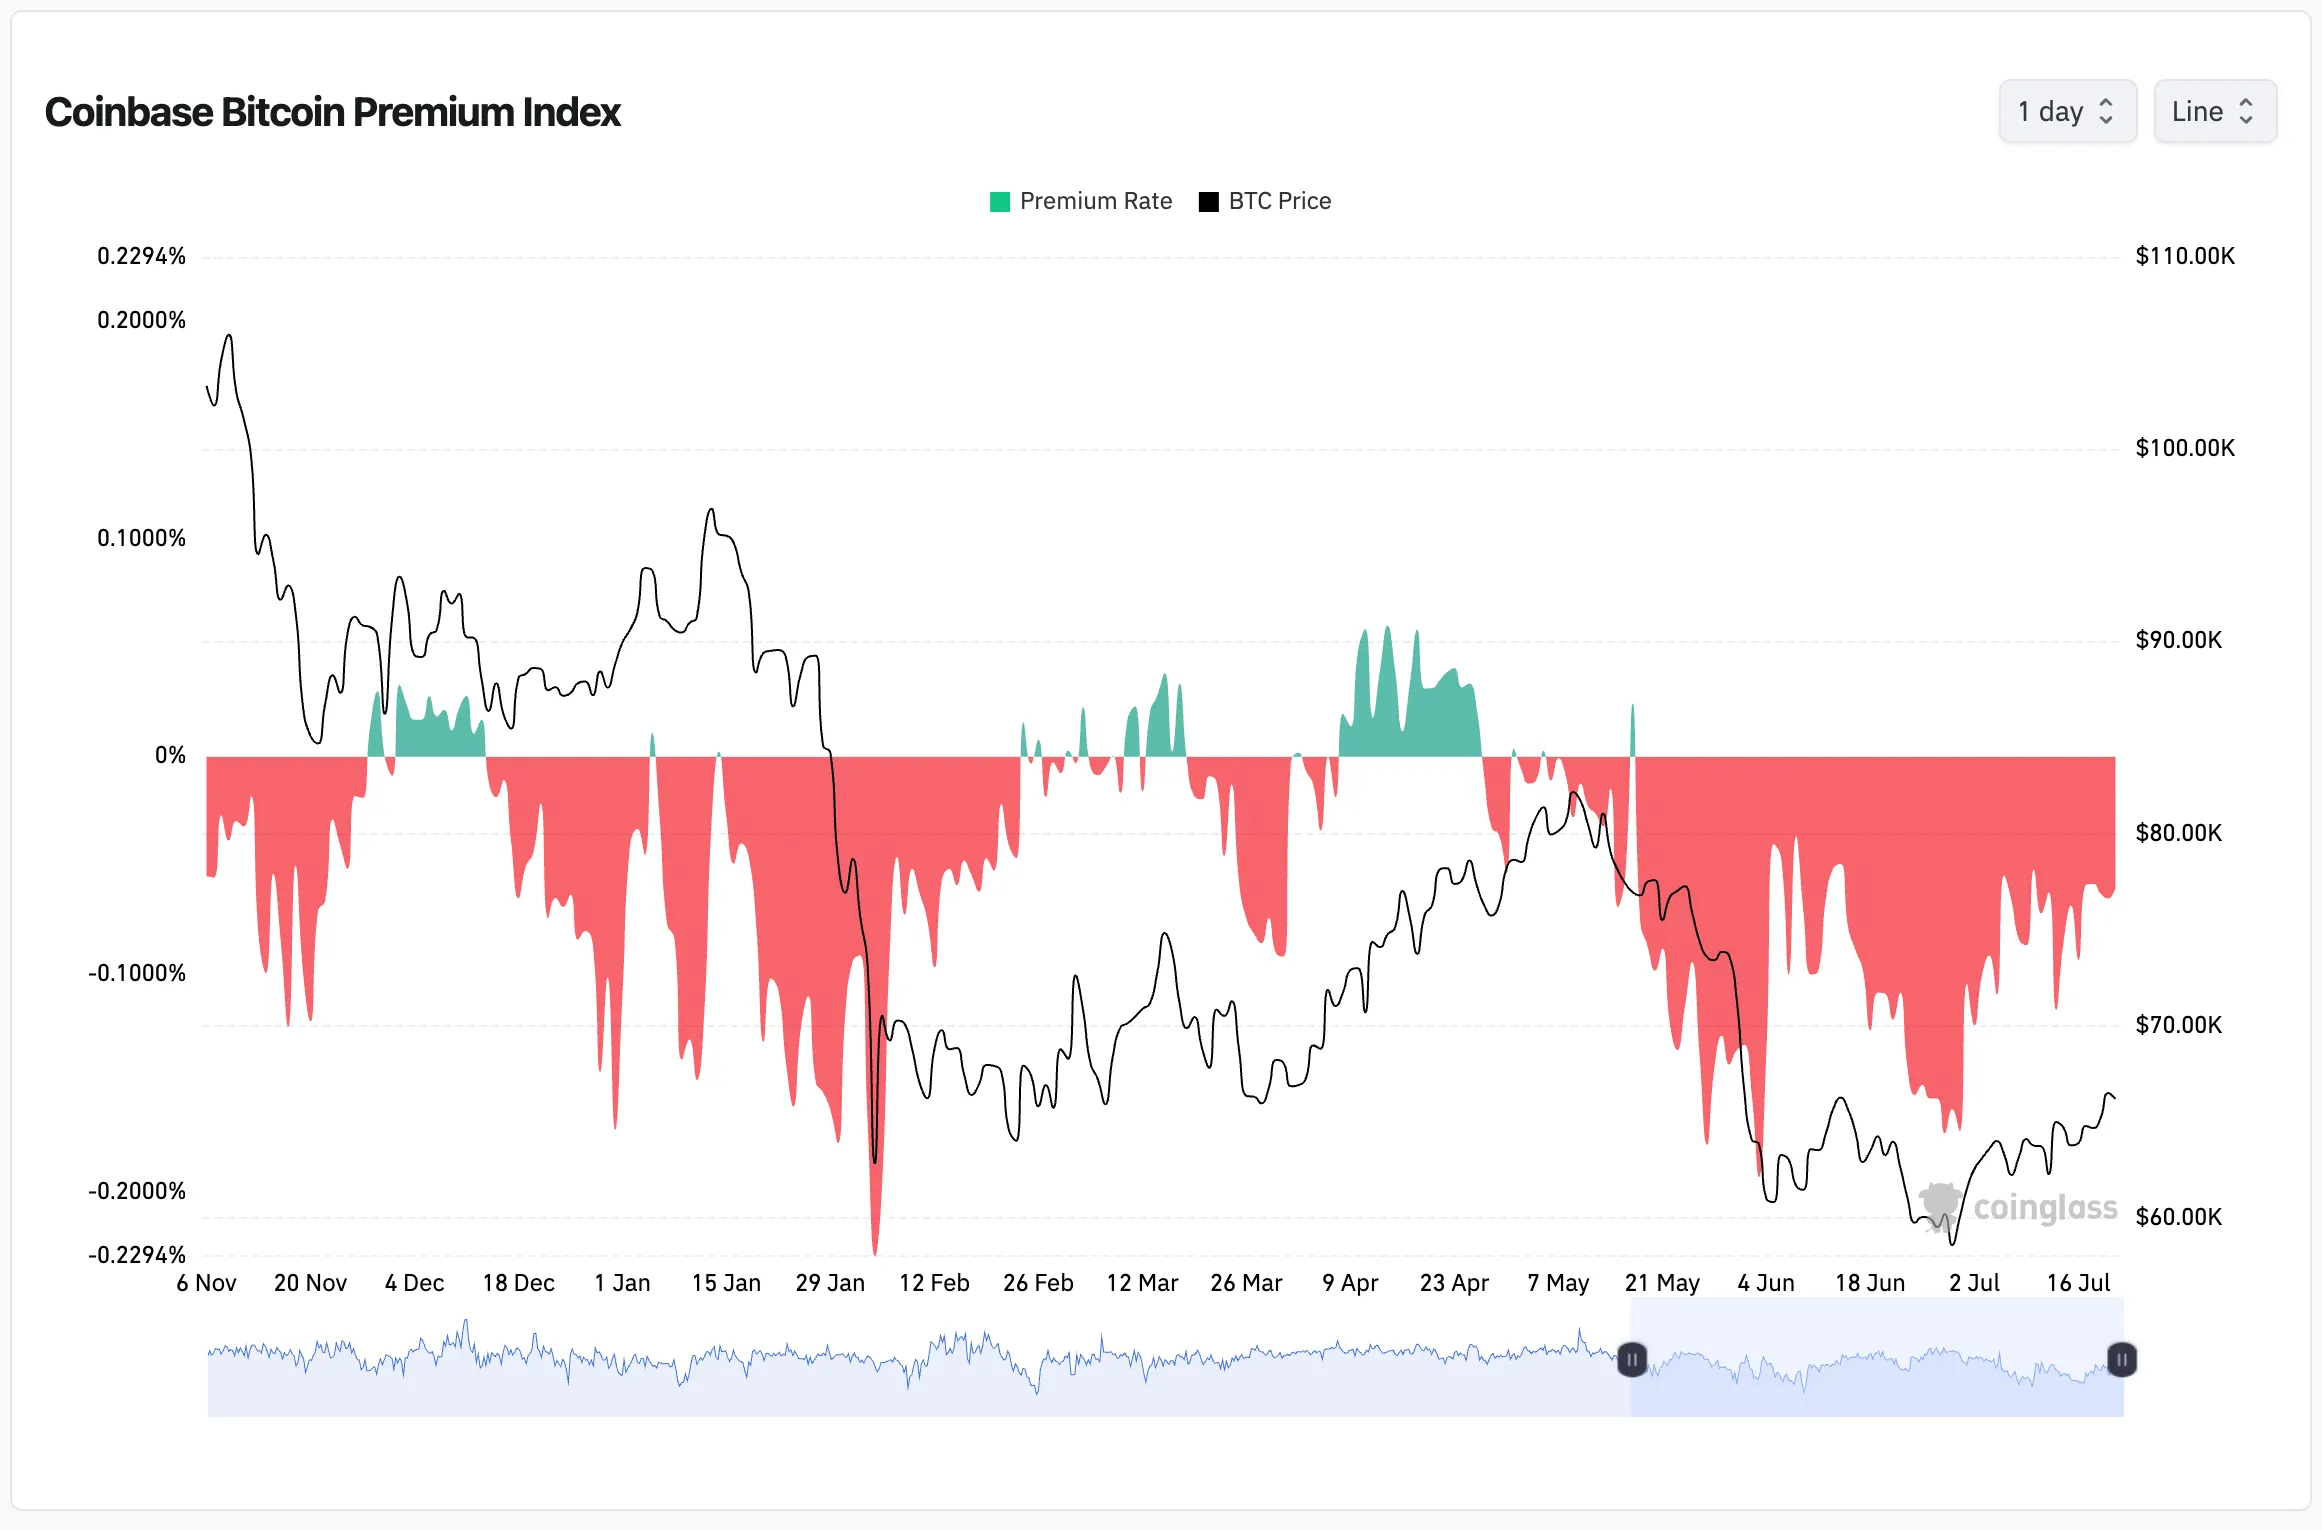
Institutional appetite also appears muted. The Coinbase Premium Index, which measures the price gap between Bitcoin on Coinbase (favored by U.S. institutions) and global exchanges, has remained in negative territory for over 900 hours. A negative premium suggests that U.S.-based institutional investors are not aggressively buying, even as prices stabilize. Analysts at Capital.com suggest this trend reflects a broader “risk-off” sentiment in global markets rather than a fundamental flaw within the cryptocurrency ecosystem itself.
On the regulatory front, there is a potential catalyst for a bullish reversal. Treasury Secretary Scott Bessent recently signaled that the Clarity Act—a significant piece of legislation aimed at defining the jurisdictional boundaries between the SEC and the CFTC—is nearing a critical vote. If passed before the upcoming congressional recess, the bill could provide the legal framework necessary to encourage greater institutional participation in the digital asset space.
Technical oscillators present a mixed bag for day traders. The Relative Strength Index (RSI) currently stands at 59.9, placing Bitcoin in bullish territory without reaching the “overbought” threshold of 70. This suggests there is still room for upward movement before the market becomes overextended. Conversely, the Average Directional Index (ADX), which measures trend strength, is at a low 19.5. Any reading below 25 generally indicates a lack of a clear trend, suggesting that while Bitcoin is moving, it lacks the conviction to sustain a major breakout in either direction.
Sentiment among retail traders remains largely skeptical. Data from the Myriad prediction market shows that 64.6% of participants believe Bitcoin is more likely to drop to $55,000 before it reaches $84,000. This bearish outlook aligns with the persistent death cross and the lack of institutional buying pressure seen in the Coinbase data. Despite this, some analysts, including those at Bernstein, maintain a long-term bullish thesis with year-end targets as high as $150,000, citing the eventual resolution of current market corrections.
For now, the market appears to be in a waiting game. The convergence of technical resistance, institutional caution, and pending regulatory developments has created a squeeze. Whether the next major move is a liquidation-driven surge toward $70,000 or a retreat to previous lows may depend on the outcome of upcoming legislative votes and the next wave of corporate earnings data.